читать и обсуждать наши публикации в телеграме
читать и обсуждать в телеграме
Согласно анализу NASA, 2022 год стал пятым годом с самой высокой температурой за всю историю наблюдений. В России этот год стал вторым самым тёплым, хуже него был только 2020 год. Кажется, это и есть глобальное потепление. Или нет? Рассказываем, как правильно описать нынешнюю ситуацию с климатом.
Что такое глобальное потепление
Понятие «глобальное потепление» относится к долгосрочному потеплению планеты. Межправительственная группа экспертов по изменению климата (МГЭИК) определяет его так: «Это повышение совокупных температур приземного воздуха и поверхности моря, усреднённых по земному шару за 30-летний период».
Глобальная температура стала активно расти с середины XX века и особенно с конца 1970-х годов. Это связано с растущими выбросами парниковых газов, которые выделяются в процессе деятельности человека. Поэтому, чтобы наблюдать, как меняется температура, учёные берут за точку отсчёта среднегодовую температуру планеты в так называемый доиндустриальный период — то есть до того, как мы начали активно промышленно развиваться и нагревать планету.

Кроме того, учёным нужны достоверные показания о температурах, но чем дальше в историю они углубляются, тем меньше находят точных данных. Поэтому МГЭИК выбрала период с 1850 по 1900 год как точку отсчёта с самыми ранними данными, имеющими относительно глобальный охват.
Последние девять лет были самыми тёплыми с 1880 года. Это означает, что Земля в 2022 году была примерно на 1,11 градуса по Цельсию теплее, чем в среднем в конце XIX века.
Что такое изменение климата
Термины «глобальное потепление» и «изменение климата» иногда используются взаимозаменяемо, но у второго более широкое значение. Изменение климата включает в себя глобальное потепление и одновременно определяет более широкий круг изменений, которые происходят на нашей планете из-за роста выбросов парниковых газов от деятельности человека.
Например, из-за изменения климата участились экстремальные погодные явления. Эксперты МГЭИК сообщают, что с 1950 года частота и интенсивность очень высоких температур увеличилась, но сильных холодов наоборот стало меньше. И чем больше будет нагреваться наша планета, тем более непредсказуемым будет поведение природы.
Среди других проявлений изменения климата – повышение уровня моря, уменьшение массы ледников, ускорение таяния льда в Гренландии, Антарктиде и Арктике, возвращение забытых болезней, исчезновение некоторых видов животных и растений, миграция людей и ещё десятки других проблем.
Есть ещё один термин – «климатический кризис». Первыми его стали использовать активисты, международные организации и СМИ, чтобы подчеркнуть угрозу изменения климата и необходимость безотлагательных действий. Сейчас так говорят уже и представители науки: ещё в 2020 году более 11 тысяч учёных со всего мира подписали «Предупреждение мировых учёных о чрезвычайной климатической ситуации», в котором заявили, что климатический кризис наступил и ускоряется быстрее, чем ожидало большинство учёных.
В нашей коммуникации мы тоже используем преимущественно словосочетание «климатический кризис», так как разделяем позицию о том, что ситуация с изменением климата стала критической.
Если не бороться с корнем проблемы — выбросами парниковых газов — эти и другие негативные последствия климатического кризиса будут только нарастать. Поддержите Гринпис, чтобы мы могли продолжить предлагать решения климатической проблемы государству и бизнесу, а также делать полезные материалы о том, как сократить собственный углеродный след и помочь планете.
климат
Как сделать отопление зелёным
Скептики часто сомневаются в том, возможна ли полноценная энергосистема на основе возобновляемых источников энергии (ВИЭ)…
Конец пожарного сезона
Декабрь — традиционное время для подведения итогов, потому что в это время вроде бы уже…
Сеул – город Солнца
В октябре 2020 года Южная Корея пообещала достичь углеродной нейтральности к 2050 году. Тогда президент…
Содержание
- 1 Причины изменения климата
- 2 Факторы изменения климата
- 3 Последствия глобальных изменений
- 4 Пути решения проблемы
Климат нашей планеты постоянно меняется и эта глобальная экологическая проблема становится все более угрожающей для человечества. Процессы потепления подтверждены многочисленными научными исследованиями, однако до сих пор ученые спорят о том, стоит ли ждать «апокалипсиса».
Некоторые климатологи полагают, что климатические изменения – естественный планетарный процесс, бояться которого не нужно. Но, по мнению большинства ученых, потепление – причина таяния ледников и повышения уровня океанов, а также учащения летних засух, мощных ураганов, наводнений.
Причины изменения климата
Климат на планете формируется под влиянием Солнца. Солнечное излучение нагревает земную поверхность неравномерно (в экваториальной области сильнее), из-за этого образуются движущиеся в определенном направлении ветры и морские течения. При повышении солнечной активности отмечаются потепления и геомагнитные бури.
Естественными причинами климатических преобразований являются сдвиги планетарной орбиты, изменения геомагнитного поля, движения материковых и океанических плит, вулканические извержения. На протяжении всей истории планеты они влияли на климат, способствовали его циклическим колебаниям, называемым ледниковыми периодами и межледниковьями.
Но на данном этапе существования планеты к естественным причинам преобразований климата добавились антропогенные, то есть связанные с деятельностью человека. Основная причина – парниковый эффект. С начала 21 века его воздействие на планету в 8 раз превысило по интенсивности воздействие солнечной радиации.
Под парниковым эффектом подразумевается задержка в атмосфере излучаемого планетой тепла. То есть атмосфера играет роль непроницаемой пленки, а Землю можно сравнить с огромной теплицей. Солнечное излучение проходит через земную атмосферу, нагревает поверхность. Но тепло, исходящее из нагретой поверхности планеты, не может уйти в космос, остается в атмосферных слоях. Причина такого явления – накопление в атмосфере в результате антропогенной деятельности газов, задерживающих исходящее из планеты длинноволновое инфракрасное излучение. Такие газы называются «парниковыми».
Факторы изменения климата
Следует подробнее рассказать о факторах, провоцирующих глобальное изменение климата на Земле:
- Солнечное излучение. Изменяющаяся солнечная активность на протяжении всего существования планеты провоцировала климатические колебания, смену ледниковых периодов межледниковьями. Кроме того, ближайшая звезда постепенно стареет, расширяется, а значит, ее влияние на планету усиливается.
- «Парниковые» газы, накапливающиеся в нижних атмосферных слоях. К ним относятся:
- водяной пар – естественный газ, участвующий в образовании облачности;
- углекислый газ появляется в атмосфере в результате разложения органики и вулканических извержений, потребляется растительностью (из-за человеческой деятельности его количество растет быстрее, чем успевают поглощать растения);
- метан поступает в атмосферу при горении биологических отходов, добыче природного газа и каменного угля, держится в атмосферных слоях несколько лет, создает парниковый эффект гораздо активнее, чем углекислый газ;
- озон бывает стратосферным и тропосферным, первый защищает планету от вредоносного ультрафиолета, второй создает парниковый эффект, несет опасность для живых организмов, образуется в результате промышленных выбросов.
- Сдвиги земной орбиты, вызванные влиянием Луны и планет Солнечной системы, приводят к изменению интенсивности солнечного излучения, поступающего на земную поверхность.
- Вулканическая активность. Газы и твердые частицы, выбрасывающиеся в атмосферу при извержении, влияют на климат, приводят к снижению температуры, засухе. Оседая на горных склонах, могут вызвать лавину или сель.
Парниковые газы накапливаются в атмосфере в результате воздействия разнообразных антропогенных факторов:
- сгорания топлива;
- использования аэрозолей;
- выброса отходов тяжелой промышленности;
- химической обработки сельскохозяйственных земель;
- животноводческой деятельности;
- вырубки лесов;
- свалок мусора и захоронений отходов.
Если бы к естественным факторам не прибавились антропогенные, то изменение климата не носило бы такой выраженный характер.
Последствия глобальных изменений
Негативных последствий глобального потепления гораздо больше, чем положительных.
Из благоприятных моментов следует отметить:
- увеличение урожайности сельскохозяйственных культур в условиях умеренного климата;
- повышение продуктивности лесных биоценозов.
Отрицательные последствия изменения климата:
- повышение влажности климата, усиление неравномерности выпадения осадков, приводящее к учащению засух и наводнений;
- повышение уровня Мирового океана, затопление мелких островов и прибрежных низменностей;
- угнетающее влияние на живую природу, слишком быстрое изменение среды обитания растительных и животных организмов (ученые предсказывают вымирание 30% не сумевших приспособиться видов);
- таяние ледников, возрастание опасности лавин и селевых потоков;
- снижение количества осадков и объема пресных водоемов, дефицит питьевой воды;
- снижение урожайности в сельскохозяйственных районах вне умеренного климата;
- негативное влияние на здоровье человека, повышение частоты сердечно-сосудистых, психических и некоторых других патологий;
- снижение продуктового обеспечение населения.
Пути решения проблемы
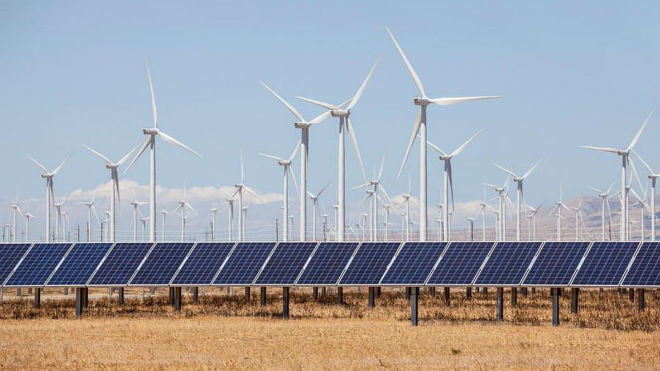
Чтобы страшные последствия глобального изменения климата не стали реальностью, человечеству необходимо срочно снизить поступление «парниковых» газов в атмосферу. Для этого нужен переход на чистые и возобновляемые источники энергии. И он неизбежен в будущем, поскольку ныне реализуемые источники топлива невозобновляемые, и они рано или поздно исчерпаются.
Для снижения концентрации углекислого газа в атмосфере требуется восстановление лесных массивов.
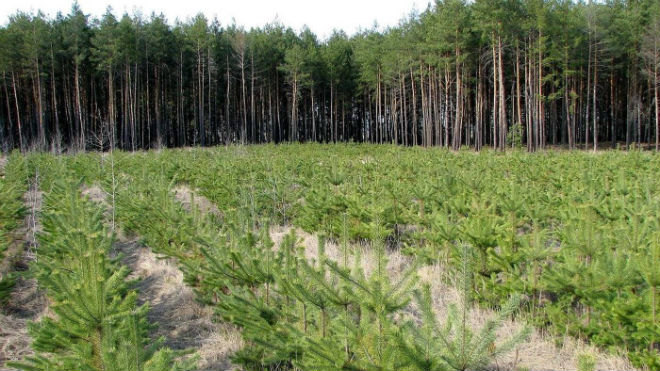
К сожалению, пока идет обратный процесс – интенсивная рубка.
Сообществом развитых стран организованы программы, направленные на борьбу с «парниковыми» выбросами. Реализуются проекты по сохранению лесов, увеличению территорий, занятых растительностью. Развивающиеся страны в рамках Киотского протокола, оформленного в 1997 году, приняли обязательства по снижению промышленных выбросов опасных газов. Во всем мире существенно увеличивается число предприятий и хозяйственных объектов, использующих ветровую и солнечную энергию для выработки топлива.
С реализацией вышеперечисленных мер нельзя затягивать. По прогнозам ученых, если климатические изменения будут продолжаться в том же темпе, то европейцев ждет тяжелое испытание: из-за таяния покровных ледников Арктики и Гренландии повысится уровень океана, течение Гольфстрим изменит направление, Европу накроет ледниковый период. Человечество во всех частях света вынуждено будет выживать в условиях засух и ураганов, эпидемических вспышек, острого дефицита пищи и питьевой воды.
ООН опубликовала отчет об изменениях климата за восемь лет. Специалисты сообщили, что температура на Земле достигла максимума за последние 125 тысяч лет, и виноваты в этом люди.
Примерно через десять лет температура на Земле превысит уровень потепления, который мировые лидеры пытались предотвратить. Положение тяжелое, но не безнадежное. Если к 2030 году получится сократить выбросы вдвое, а еще через 20 лет полностью избавиться от них, то климат удастся восстановить.
Именно сейчас каждый правильный поступок человека способен изменить климат в лучшую сторону. Вот семь способов, которые могут позволить сделать это.
1. Покупайте и используйте меньше. Это касается всего — от энергии до потребительских товаров. Каждый раз, когда вы заказываете случайную безделушку в Интернете, подумайте о выбросах парниковых газов, которые были выделены при ее изготовлении, и решите, действительно ли она вам нужна.

2. Электромобиль — транспорт будущего. По данным Агентства по охране окружающей среды, на транспорт приходится около 29% от общего объема выбросов парниковых газов в США. В Китае эта цифра еще больше, что делает его крупнейшим источником выбросов парниковых газов. Переход на электромобили может свести эти показатели к нулю.
3. Уменьшите потребление энергии в доме. Это позволит не только сократить выбросы газа в природу, но и сэкономить ваши деньги. Рассмотрите также варианты использования возобновляемых источников энергии для вашего дома, например системы солнечной энергии. Со временем эти системы также сэкономят вам деньги.

4. Ешьте разумно. Вы — то, что вы едите, и планета тоже. Осознанное питание способно уменьшить глобальное потепление. Это означает, что нужно есть меньше продуктов животного происхождения.
5. Меньше транспорта в нашей жизни. Ходите пешком или ездите на велосипеде, когда это возможно, а не за рулем. Это легко, когда вы живете в городе и вам не нужно добираться куда-то далеко. Может, это и дольше, чем на машине, но значительно безопасней для окружающей среды.
6. Скажите «нет» пластику. Стоит ли упоминать о вреде пластика? Если его производство продолжит расти, то к 2050 году объем выбросов парниковых газов может превысить 56 гигатонн. Сейчас отказаться от пластика намного проще, чем, например, десять лет назад. Авоськи, шопперы и бумажные пакеты можно использовать вместо пластиковых. Пластиковую посуду легко заменить перерабатываемой, а напитки следует покупать в стекле.

7. Поговорите об этой проблеме с друзьями, семьей и соседями. После того как вы решите что-то изменить в своей жизни и помочь планете, расскажите об этом знакомым, дайте им понять, почему это важно и какой результат это даст. Возможно, эффект бабочки, который вы создадите, ускорит спасение климата.
Для борьбы с глобальным потеплением практически все страны мира присоединились к Парижскому соглашению 2015 года, которое старается удержать потепление в пределах 1,5 °С. Страны-участники обязаны сократить парниковые выбросы — сжигать меньше угля и нефти, развивать электротранспорт и альтернативные источники энергии, ужесточать нормы, связанные с загрязнением воздуха. Но, если судить по последнему докладу МГЭИК, человечество находится на переломном этапе, когда речь заходит об изменении климата. Сейчас как никогда самое время отнестись к этому серьезно.
1
Сегодня нам известно, что причина изменения климата — в растущих объемах парниковых газов, которыми мы наполняем атмосферу, сжигая ископаемое топливо. Но нам также известно, что не все страны несут за это одинаковую ответственность, что не может не вызывать вопросов, особенно в эпоху борьбы за тотальную справедливость.
С начала промышленной революции человечество выбросило в земную атмосферу около 2,5 млрд тонн CO2, что привело к нагреванию поверхности планеты на 1,2 °C. Теперь главной климатической целью — которую предлагают ученые и поддерживают лидеры почти всех государств — считается удержание глобального потепления в пределах 1,5 °C по сравнению с доиндустриальным уровнем. Вопрос в том, кому достанется привилегия истратить «углеродный бюджет» планеты.
До середины XIX века небо коптил один-единственный континент — Европа. Затем подключились США, и только в начале XX века к ним потихоньку стали присоединяться другие страны.
Несмотря на то, что сейчас среди главных эмиттеров CO2 значатся Китай, Индия, Россия и Япония, исторически больше всего ответственности за парниковый эффект лежит на европейских странах (34% всех когда-либо произведенных антропогенных выбросов).
На втором месте США, которые ответственны за 27% всего углекислого газа, попавшего в атмосферу из-за сжигания ископаемого топлива или промышленной деятельности.
В 2020 году британский антрополог Джейсон Хикель рассчитал, какой вклад в рост концентрации CO2 в атмосфере разные государства внесли с 1850 по 2015 годы, и выяснил, что 92% всех выбросов пришлось на Глобальный Север. Расчет строился на понимании, что атмосферный воздух — это ничейное и одновременно всеобщее достояние. За последние полтора века США и Европейский союз поспособствовали насыщению парниковыми газами на 40% и 29% соответственно, в то время как большинство стран Глобального Юга до сих пор далеки от того, чтобы исчерпать свою «справедливую долю». В том числе такие важные игроки, как Китай и Индия: стремительный экономический рост уже поднял их в топ эмиттеров CO2, но они по-прежнему отстаивают свое право на развитие в ущерб экологии и климату.
2
Отличный пример того, как страны, опоздавшие к разделу углеродного пирога, пытаются восстановить справедливость, — это торги китайской и индийской делегаций с остальными участниками СОР26, предыдущей конференции ООН по климату, которая проходила в Глазго в 2021 году. Завершилась она откровенно провально, а главными «климатическими злодеями» объявили Индию и Китай, поскольку в последний момент они настояли на замене формулировок в финальном пакте, который готовы были подписать почти 200 стран. В итоге вместо отказа (phase out) от угольной промышленности, участники конференции зафиксировали готовность лишь сократить ее (phase down), в очередной раз отсрочив закат ископаемого топлива.
Тогда Китай и Индия защитили свое право эксплуатировать колоссальные внутренние ресурсы угля, надавив на чувство вины коллективного Запада.
Дескать, именно промышленно развитые страны, попутно обогащаясь, всё это время вели мир к климатической и экологической катастрофе, и теперь, вместо того, чтобы поучать, могли бы сделать остальным поблажку. Либо дать деньгами — глава китайской делегации в Глазго выразил надежду, что в переходе на чистую энергию развитые страны финансово и технически поддержат развивающихся соседей (видимо, причисляя к ним и Китай).
Хотя Китай пытается прикинуться ветошью, объем его исторических выбросов CO2 уже превысил 15% и поставил страну на третье место в рейтинге глобальной климатической ответственности — после США и ЕС. И пусть в Китае, Индии, Бразилии, ЮАР потребительские выбросы на душу населения до сих пор далеки от показателей наиболее развитых и богатых стран, они тоже быстро растут (как растет и потребление дешевого энергоемкого угля). Судя по исследованию Джейсона Хикеля, скоро китайские топливные и промышленные выбросы тоже превысят свою «справедливую» историческую долю, так что стране недолго осталось притворяться частью третьего мира.
Но есть и гораздо более обделенные государства — например, наименее развитые страны Африки, которые не успели нажечь ископаемых ресурсов на сколько-нибудь серьезную долю ответственности. Когда в мае члены Большой семерки обязались к концу 2022 года прекратить инвестиции в зарубежные проекты, связанные с нефтью, газом или углем, президент Нигера Мохамед Базум назвал это решение «наказанием» для Африки, ведь она хранит ресурсы ископаемого топлива, которые «необходимо осваивать». Его поддержал президент Сенегала Маки Салл: «Дайте африканскому континенту воспользоваться своими природными богатствами. Честно говоря, поразительно, как те, кто больше века эксплуатировал нефть и нефтепродукты, препятствует тому, чтобы Африка извлекала выгоду из собственных ресурсов».
Но помимо защиты права самим распоряжаться своими запасами, государства, только недавно получившие независимость от европейских метрополий, могут давить на болевые точки Запада, озабоченного постколониальной рефлексией. Климатолог из Национального института перспективных исследований Индии Теджал Каниткар, например, считает, что страны, у которых была возможность развиваться, попросту «оккупировали атмосферу», и если там осталось место, его стоит отдать тем странам, которые не успели выстроить соответствующую инфраструктуру — теперь их очередь накачивать воздух углекислым газом. Самое тревожное, что в стремлении восстановить мировую справедливость и богатые, и бедные страны всё чаще упоминают «право» последних развиваться несмотря ни на что, часто — чтобы догнать первых.
Но о каком праве можно говорить перед лицом катастрофы, о которой уже несколько десятков лет предупреждают климатологи, океанологи, метеорологи и биологи? О праве еще больше открыть кран, когда все и так стоят по колено в воде?
Ученые предупреждают, что если глобальное потепление превысит 1,5 °C, миллионы людей окажутся в условиях невыносимой жары, растает половина земных ледников, из нагревшегося океана практически исчезнут коралловые рифы, усилятся природные катаклизмы и произойдет еще много печальных изменений, на обсуждение которых, впрочем, не стоит тратить времени, потому что человечеству явно не удастся удержать рост температуры в пределах 1,5 °C. Вероятнее всего, к концу XXI века поверхность планеты нагреется на 2 °С, 3 °С или даже 4 °C — вот к чему на самом деле стоит готовиться. Подобное потепление может привести к повсеместным наводнениям, засухам, пожарам, нехватке продовольствия, потере земного биоразнообразия и другим необратимым изменениям в экосистемах. У нас пока нет моделей, которые давали бы понимание, как будет выглядеть планета, перегревшаяся на 4 °C. Нет у нас и понимания, что сейчас ничья очередь разрушать планету.
3
И всё же не совсем честно тормозить чужое развитие, если сам только что завершил свое. Но если пытаться наверстать упущенное абсурдно, не лучше ли развивающимся странам взять деньгами? Как это сделала Боливия, которая в 1987 году выделила 1,5 млн га своей земли в бассейне Амазонки под природоохранные цели в обмен на списание 650 тыс. долларов внешнего долга. Или как это сделали Ямайка и Перу, которым правительство США простило часть долга за обещание не вырубать свои леса. Или как это сделали Сейшельские острова, которым ООН и Глобальный экологический фонд гарантировали списание 27 млн долларов долга за создание морской заповедной зоны площадью 400 тыс. км².
В июне активисты организации «Долги на климат» (Debt for Climate), которая защищает интересы Глобального Юга и выступает за объединение социальной и климатической справедливости, заблокировали вход в парижский офис Международного валютного фонда, призывая страны G7 списать задолженности развивающихся стран, чтобы помочь им в борьбе с изменением климата. Мысль в том, что Глобальный Юг мог бы заработать триллионы долларов на своих потенциальных полезных ископаемых: снимите долг — и те останутся под землей, где им и место.
В организации считают, что МВФ, Большая семерка и Всемирный банк — это наследие эксплуататоров и колонизаторов, создавших «экономически колониальную» систему финансов и торговли, в которой до сих пор доминируют богатые страны. К тому же Глобальный Север сам в большом долгу у бедных стран, ведь они находятся на передовой климатического кризиса и первыми ощущают на себе его последствия.
Из сложения всех этих аргументов родилась концепция своего рода климатических репараций — возмещения ущерба наименее развитым странам (в основном бывшим колониям, островным государствам и участникам Форума климатически уязвимых стран), которое легло на плечи богатых государств, виновных в изменении климата несоразмерно больше. В 2022 году климатический саммит ООН завершился договоренностью о создании стратегического фонда, который будет компенсировать развивающимся странам уже понесенные климатические убытки и помогать им перейти на чистую энергетику. Учитывая, что человечество стоит на пороге климатической катастрофы, это пока самая удачная попытка не передраться за право ее приблизить.
For the human-induced rise in Earth’s average temperature and its effects, see Climate change.
Climate variability includes all the variations in the climate that last longer than individual weather events, whereas the term climate change only refers to those variations that persist for a longer period of time, typically decades or more. Climate change may refer to any time in Earth’s history, but the term is now commonly used to describe contemporary climate change. Since the Industrial Revolution, the climate has increasingly been affected by human activities.[1]
The climate system receives nearly all of its energy from the sun and radiates energy to outer space. The balance of incoming and outgoing energy and the passage of the energy through the climate system is Earth’s energy budget. When the incoming energy is greater than the outgoing energy, Earth’s energy budget is positive and the climate system is warming. If more energy goes out, the energy budget is negative and Earth experiences cooling.
The energy moving through Earth’s climate system finds expression in weather, varying on geographic scales and time. Long-term averages and variability of weather in a region constitute the region’s climate. Such changes can be the result of «internal variability», when natural processes inherent to the various parts of the climate system alter the distribution of energy. Examples include variability in ocean basins such as the Pacific decadal oscillation and Atlantic multidecadal oscillation. Climate variability can also result from external forcing, when events outside of the climate system’s components produce changes within the system. Examples include changes in solar output and volcanism.
Climate variability has consequences for sea level changes, plant life, and mass extinctions; it also affects human societies.
Terminology
Climate variability is the term to describe variations in the mean state and other characteristics of climate (such as chances or possibility of extreme weather, etc.) «on all spatial and temporal scales beyond that of individual weather events.» Some of the variability does not appear to be caused by known systems and occurs at seemingly random times. Such variability is called random variability or noise. On the other hand, periodic variability occurs relatively regularly and in distinct modes of variability or climate patterns.[2]
The term climate change is often used to refer specifically to anthropogenic climate change (also known as global warming). Anthropogenic climate change is caused by human activity, as opposed to changes in climate that may have resulted as part of Earth’s natural processes.[3]
In this sense, the term climate change has become synonymous with anthropogenic global warming. Within scientific journals, global warming refers to surface temperature increases while climate change includes global warming and everything else that increasing greenhouse gas levels affect.[4]
A related term, climatic change, was proposed by the World Meteorological Organization (WMO) in 1966 to encompass all forms of climatic variability on time-scales longer than 10 years, but regardless of cause. During the 1970s, the term climate change replaced climatic change to focus on anthropogenic causes, as it became clear that human activities had a potential to drastically alter the climate.[5] Climate change was incorporated in the title of the Intergovernmental Panel on Climate Change (IPCC) and the UN Framework Convention on Climate Change (UNFCCC). Climate change is now used as both a technical description of the process, as well as a noun used to describe the problem.[5]
Causes
On the broadest scale, the rate at which energy is received from the Sun and the rate at which it is lost to space determine the equilibrium temperature and climate of Earth. This energy is distributed around the globe by winds, ocean currents,[6][7] and other mechanisms to affect the climates of different regions.[8]
Factors that can shape climate are called climate forcings or «forcing mechanisms».[9] These include processes such as variations in solar radiation, variations in the Earth’s orbit, variations in the albedo or reflectivity of the continents, atmosphere, and oceans, mountain-building and continental drift and changes in greenhouse gas concentrations. External forcing can be either anthropogenic (e.g. increased emissions of greenhouse gases and dust) or natural (e.g., changes in solar output, the Earth’s orbit, volcano eruptions).[10] There are a variety of climate change feedbacks that can either amplify or diminish the initial forcing. There are also key thresholds which when exceeded can produce rapid or irreversible change.
Some parts of the climate system, such as the oceans and ice caps, respond more slowly in reaction to climate forcings, while others respond more quickly. An example of fast change is the atmospheric cooling after a volcanic eruption, when volcanic ash reflects sunlight. Thermal expansion of ocean water after atmospheric warming is slow, and can take thousands of years. A combination is also possible, e.g., sudden loss of albedo in the Arctic Ocean as sea ice melts, followed by more gradual thermal expansion of the water.
Climate variability can also occur due to internal processes. Internal unforced processes often involve changes in the distribution of energy in the ocean and atmosphere, for instance, changes in the thermohaline circulation.
Internal variability
Climatic changes due to internal variability sometimes occur in cycles or oscillations. For other types of natural climatic change, we cannot predict when it happens; the change is called random or stochastic.[11] From a climate perspective, the weather can be considered random.[12] If there are little clouds in a particular year, there is an energy imbalance and extra heat can be absorbed by the oceans. Due to climate inertia, this signal can be ‘stored’ in the ocean and be expressed as variability on longer time scales than the original weather disturbances.[13] If the weather disturbances are completely random, occurring as white noise, the inertia of glaciers or oceans can transform this into climate changes where longer-duration oscillations are also larger oscillations, a phenomenon called red noise.[14] Many climate changes have a random aspect and a cyclical aspect. This behavior is dubbed stochastic resonance.[14] Half of the 2021 Nobel prize on physics was awarded for this work to Klaus Hasselmann jointly with Syukuro Manabe for related work on climate modelling. While Giorgio Parisi who with collaborators introduced[15] the concept of stochastic resonance was awarded the other half but mainly for work on theoretical physics.
Ocean-atmosphere variability

The ocean and atmosphere can work together to spontaneously generate internal climate variability that can persist for years to decades at a time.[16][17] These variations can affect global average surface temperature by redistributing heat between the deep ocean and the atmosphere[18][19] and/or by altering the cloud/water vapor/sea ice distribution which can affect the total energy budget of the Earth.[20][21]
Oscillations and cycles
A climate oscillation or climate cycle is any recurring cyclical oscillation within global or regional climate. They are quasiperiodic (not perfectly periodic), so a Fourier analysis of the data does not have sharp peaks in the spectrum. Many oscillations on different time-scales have been found or hypothesized:[22]
- the El Niño–Southern Oscillation (ENSO) – A large scale pattern of warmer (El Niño) and colder (La Niña) tropical sea surface temperatures in the Pacific Ocean with worldwide effects. It is a self-sustaining oscillation, whose mechanisms are well-studied.[23] ENSO is the most prominent known source of inter-annual variability in weather and climate around the world. The cycle occurs every two to seven years, with El Niño lasting nine months to two years within the longer term cycle.[24] The cold tongue of the equatorial Pacific Ocean is not warming as fast as the rest of the ocean, due to increased upwelling of cold waters off the west coast of South America.[25][26]
- the Madden–Julian oscillation (MJO) – An eastward moving pattern of increased rainfall over the tropics with a period of 30 to 60 days, observed mainly over the Indian and Pacific Oceans.[27]
- the North Atlantic oscillation (NAO) – Indices of the NAO are based on the difference of normalized sea-level pressure (SLP) between Ponta Delgada, Azores and Stykkishólmur/Reykjavík, Iceland. Positive values of the index indicate stronger-than-average westerlies over the middle latitudes.[28]
- the Quasi-biennial oscillation – a well-understood oscillation in wind patterns in the stratosphere around the equator. Over a period of 28 months the dominant wind changes from easterly to westerly and back.[29]
- Pacific Centennial Oscillation — a climate oscillation predicted by some climate models
- the Pacific decadal oscillation – The dominant pattern of sea surface variability in the North Pacific on a decadal scale. During a «warm», or «positive», phase, the west Pacific becomes cool and part of the eastern ocean warms; during a «cool» or «negative» phase, the opposite pattern occurs. It is thought not as a single phenomenon, but instead a combination of different physical processes.[30]
- the Interdecadal Pacific oscillation (IPO) – Basin wide variability in the Pacific Ocean with a period between 20 and 30 years.[31]
- the Atlantic multidecadal oscillation – A pattern of variability in the North Atlantic of about 55 to 70 years, with effects on rainfall, droughts and hurricane frequency and intensity.[32]
- North African climate cycles – climate variation driven by the North African Monsoon, with a period of tens of thousands of years.[33]
- the Arctic oscillation (AO) and Antarctic oscillation (AAO) – The annular modes are naturally occurring, hemispheric-wide patterns of climate variability. On timescales of weeks to months they explain 20-30% of the variability in their respective hemispheres. The Northern Annular Mode or Arctic oscillation (AO) in the Northern Hemisphere, and the Southern Annular Mode or Antarctic oscillation (AAO) in the southern hemisphere. The annular modes have a strong influence on the temperature and precipitation of mid-to-high latitude land masses, such as Europe and Australia, by altering the average paths of storms. The NAO can be considered a regional index of the AO/NAM.[34] They are defined as the first EOF of sea level pressure or geopotential height from 20°N to 90°N (NAM) or 20°S to 90°S (SAM).
- Dansgaard–Oeschger cycles – occurring on roughly 1,500-year cycles during the Last Glacial Maximum
Ocean current changes
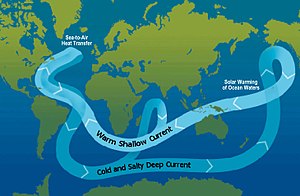
A schematic of modern thermohaline circulation. Tens of millions of years ago, continental-plate movement formed a land-free gap around Antarctica, allowing the formation of the ACC, which keeps warm waters away from Antarctica.
The oceanic aspects of climate variability can generate variability on centennial timescales due to the ocean having hundreds of times more mass than in the atmosphere, and thus very high thermal inertia. For example, alterations to ocean processes such as thermohaline circulation play a key role in redistributing heat in the world’s oceans.
Ocean currents transport a lot of energy from the warm tropical regions to the colder polar regions. Changes occurring around the last ice age (in technical terms, the last glacial) show that the circulation is the North Atlantic can change suddenly and substantially, leading to global climate changes, even though the total amount of energy coming into the climate system didn’t change much. These large changes may have come from so called Heinrich events where internal instability of ice sheets caused huge ice bergs to be released into the ocean. When the ice sheet melts, the resulting water is very low in salt and cold, driving changes in circulation.[35]
Life
Life affects climate through its role in the carbon and water cycles and through such mechanisms as albedo, evapotranspiration, cloud formation, and weathering.[36][37][38] Examples of how life may have affected past climate include:
- glaciation 2.3 billion years ago triggered by the evolution of oxygenic photosynthesis, which depleted the atmosphere of the greenhouse gas carbon dioxide and introduced free oxygen[39][40]
- another glaciation 300 million years ago ushered in by long-term burial of decomposition-resistant detritus of vascular land-plants (creating a carbon sink and forming coal)[41][42]
- termination of the Paleocene–Eocene Thermal Maximum 55 million years ago by flourishing marine phytoplankton[43][44]
- reversal of global warming 49 million years ago by 800,000 years of arctic azolla blooms[45][46]
- global cooling over the past 40 million years driven by the expansion of grass-grazer ecosystems[47][48]
External climate forcing
Greenhouse gases
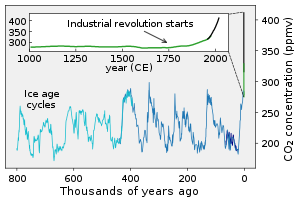
CO2 concentrations over the last 800,000 years as measured from ice cores (blue/green) and directly (black)
Whereas greenhouse gases released by the biosphere is often seen as a feedback or internal climate process, greenhouse gases emitted from volcanoes are typically classified as external by climatologists.[49] Greenhouse gases, such as CO2, methane and nitrous oxide, heat the climate system by trapping infrared light. Volcanoes are also part of the extended carbon cycle. Over very long (geological) time periods, they release carbon dioxide from the Earth’s crust and mantle, counteracting the uptake by sedimentary rocks and other geological carbon dioxide sinks.
Since the industrial revolution, humanity has been adding to greenhouse gases by emitting CO2 from fossil fuel combustion, changing land use through deforestation, and has further altered the climate with aerosols (particulate matter in the atmosphere),[50] release of trace gases (e.g. nitrogen oxides, carbon monoxide, or methane).[51] Other factors, including land use, ozone depletion, animal husbandry (ruminant animals such as cattle produce methane[52]), and deforestation, also play a role.[53]
The US Geological Survey estimates are that volcanic emissions are at a much lower level than the effects of current human activities, which generate 100–300 times the amount of carbon dioxide emitted by volcanoes.[54] The annual amount put out by human activities may be greater than the amount released by supereruptions, the most recent of which was the Toba eruption in Indonesia 74,000 years ago.[55]
Orbital variations
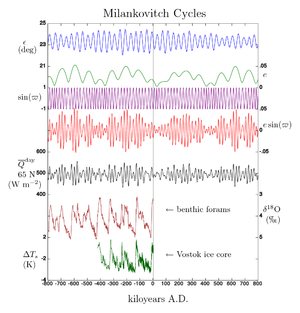
Milankovitch cycles from 800,000 years ago in the past to 800,000 years in the future.
Slight variations in Earth’s motion lead to changes in the seasonal distribution of sunlight reaching the Earth’s surface and how it is distributed across the globe. There is very little change to the area-averaged annually averaged sunshine; but there can be strong changes in the geographical and seasonal distribution. The three types of kinematic change are variations in Earth’s eccentricity, changes in the tilt angle of Earth’s axis of rotation, and precession of Earth’s axis. Combined, these produce Milankovitch cycles which affect climate and are notable for their correlation to glacial and interglacial periods,[56] their correlation with the advance and retreat of the Sahara,[56] and for their appearance in the stratigraphic record.[57][58]
During the glacial cycles, there was a high correlation between CO2 concentrations and temperatures. Early studies indicated that CO2 concentrations lagged temperatures, but it has become clear that this isn’t always the case.[59] When ocean temperatures increase, the solubility of CO2 decreases so that it is released from the ocean. The exchange of CO2 between the air and the ocean can also be impacted by further aspects of climatic change.[60] These and other self-reinforcing processes allow small changes in Earth’s motion to have a large effect on climate.[59]
Solar output

Variations in solar activity during the last several centuries based on observations of sunspots and beryllium isotopes. The period of extraordinarily few sunspots in the late 17th century was the Maunder minimum.
The Sun is the predominant source of energy input to the Earth’s climate system. Other sources include geothermal energy from the Earth’s core, tidal energy from the Moon and heat from the decay of radioactive compounds. Both long term variations in solar intensity are known to affect global climate.[61] Solar output varies on shorter time scales, including the 11-year solar cycle[62] and longer-term modulations.[63] Correlation between sunspots and climate and tenuous at best.[61]
Three to four billion years ago, the Sun emitted only 75% as much power as it does today.[64] If the atmospheric composition had been the same as today, liquid water should not have existed on the Earth’s surface. However, there is evidence for the presence of water on the early Earth, in the Hadean[65][66] and Archean[67][65] eons, leading to what is known as the faint young Sun paradox.[68] Hypothesized solutions to this paradox include a vastly different atmosphere, with much higher concentrations of greenhouse gases than currently exist.[69] Over the following approximately 4 billion years, the energy output of the Sun increased. Over the next five billion years, the Sun’s ultimate death as it becomes a red giant and then a white dwarf will have large effects on climate, with the red giant phase possibly ending any life on Earth that survives until that time.[70]
Volcanism

In atmospheric temperature from 1979 to 2010, determined by MSU NASA satellites, effects appear from aerosols released by major volcanic eruptions (El Chichón and Pinatubo). El Niño is a separate event, from ocean variability.
The eruptions considered to be large enough to affect the Earth’s climate on a scale of more than 1 year are the ones that inject over 100,000 tons of SO2 into the stratosphere.[71] This is due to the optical properties of SO2 and sulfate aerosols, which strongly absorb or scatter solar radiation, creating a global layer of sulfuric acid haze.[72] On average, such eruptions occur several times per century, and cause cooling (by partially blocking the transmission of solar radiation to the Earth’s surface) for a period of several years. Although volcanoes are technically part of the lithosphere, which itself is part of the climate system, the IPCC explicitly defines volcanism as an external forcing agent.[73]
Notable eruptions in the historical records are the 1991 eruption of Mount Pinatubo which lowered global temperatures by about 0.5 °C (0.9 °F) for up to three years,[74][75] and the 1815 eruption of Mount Tambora causing the Year Without a Summer.[76]
At a larger scale—a few times every 50 million to 100 million years—the eruption of large igneous provinces brings large quantities of igneous rock from the mantle and lithosphere to the Earth’s surface. Carbon dioxide in the rock is then released into the atmosphere.[77]
[78] Small eruptions, with injections of less than 0.1 Mt of sulfur dioxide into the stratosphere, affect the atmosphere only subtly, as temperature changes are comparable with natural variability. However, because smaller eruptions occur at a much higher frequency, they too significantly affect Earth’s atmosphere.[71][79]
Plate tectonics
Over the course of millions of years, the motion of tectonic plates reconfigures global land and ocean areas and generates topography. This can affect both global and local patterns of climate and atmosphere-ocean circulation.[80]
The position of the continents determines the geometry of the oceans and therefore influences patterns of ocean circulation. The locations of the seas are important in controlling the transfer of heat and moisture across the globe, and therefore, in determining global climate. A recent example of tectonic control on ocean circulation is the formation of the Isthmus of Panama about 5 million years ago, which shut off direct mixing between the Atlantic and Pacific Oceans. This strongly affected the ocean dynamics of what is now the Gulf Stream and may have led to Northern Hemisphere ice cover.[81][82] During the Carboniferous period, about 300 to 360 million years ago, plate tectonics may have triggered large-scale storage of carbon and increased glaciation.[83] Geologic evidence points to a «megamonsoonal» circulation pattern during the time of the supercontinent Pangaea, and climate modeling suggests that the existence of the supercontinent was conducive to the establishment of monsoons.[84]
The size of continents is also important. Because of the stabilizing effect of the oceans on temperature, yearly temperature variations are generally lower in coastal areas than they are inland. A larger supercontinent will therefore have more area in which climate is strongly seasonal than will several smaller continents or islands.
Other mechanisms
It has been postulated that ionized particles known as cosmic rays could impact cloud cover and thereby the climate. As the sun shields the Earth from these particles, changes in solar activity were hypothesized to influence climate indirectly as well. To test the hypothesis, CERN designed the CLOUD experiment, which showed the effect of cosmic rays is too weak to influence climate noticeably.[85][86]
Evidence exists that the Chicxulub asteroid impact some 66 million years ago had severely affected the Earth’s climate. Large quantities of sulfate aerosols were kicked up into the atmosphere, decreasing global temperatures by up to 26 °C and producing sub-freezing temperatures for a period of 3–16 years. The recovery time for this event took more than 30 years.[87] The large-scale use of nuclear weapons has also been investigated for its impact on the climate. The hypothesis is that soot released by large-scale fires blocks a significant fraction of sunlight for as much as a year, leading to a sharp drop in temperatures for a few years. This possible event is described as nuclear winter.[88]
Humans’ use of land impact how much sunlight the surface reflects and the concentration of dust. Cloud formation is not only influenced by how much water is in the air and the temperature, but also by the amount of aerosols in the air such as dust.[89] Globally, more dust is available if there are many regions with dry soils, little vegetation and strong winds.[90]
Evidence and measurement of climate changes
Paleoclimatology is the study of changes in climate through the entire history of Earth. It uses a variety of proxy methods from the Earth and life sciences to obtain data preserved within things such as rocks, sediments, ice sheets, tree rings, corals, shells, and microfossils. It then uses the records to determine the past states of the Earth’s various climate regions and its atmospheric system. Direct measurements give a more complete overview of climate variability.
Direct measurements
Climate changes that occurred after the widespread deployment of measuring devices can be observed directly. Reasonably complete global records of surface temperature are available beginning from the mid-late 19th century. Further observations are derived indirectly from historical documents. Satellite cloud and precipitation data has been available since the 1970s.[91]
Historical climatology is the study of historical changes in climate and their effect on human history and development. The primary sources include written records such as sagas, chronicles, maps and local history literature as well as pictorial representations such as paintings, drawings and even rock art. Climate variability in the recent past may be derived from changes in settlement and agricultural patterns.[92] Archaeological evidence, oral history and historical documents can offer insights into past changes in the climate. Changes in climate have been linked to the rise[93] and the collapse of various civilizations.[92]
Proxy measurements

Variations in CO2, temperature and dust from the Vostok ice core over the last 450,000 years.
Various archives of past climate are present in rocks, trees and fossils. From these archives, indirect measures of climate, so-called proxies, can be derived. Quantification of climatological variation of precipitation in prior centuries and epochs is less complete but approximated using proxies such as marine sediments, ice cores, cave stalagmites, and tree rings.[94] Stress, too little precipitation or unsuitable temperatures, can alter the growth rate of trees, which allows scientists to infer climate trends by analyzing the growth rate of tree rings. This branch of science studying this called dendroclimatology.[95] Glaciers leave behind moraines that contain a wealth of material—including organic matter, quartz, and potassium that may be dated—recording the periods in which a glacier advanced and retreated.
Analysis of ice in cores drilled from an ice sheet such as the Antarctic ice sheet, can be used to show a link between temperature and global sea level variations. The air trapped in bubbles in the ice can also reveal the CO2 variations of the atmosphere from the distant past, well before modern environmental influences. The study of these ice cores has been a significant indicator of the changes in CO2 over many millennia, and continues to provide valuable information about the differences between ancient and modern atmospheric conditions. The 18O/16O ratio in calcite and ice core samples used to deduce ocean temperature in the distant past is an example of a temperature proxy method.
The remnants of plants, and specifically pollen, are also used to study climatic change. Plant distributions vary under different climate conditions. Different groups of plants have pollen with distinctive shapes and surface textures, and since the outer surface of pollen is composed of a very resilient material, they resist decay. Changes in the type of pollen found in different layers of sediment indicate changes in plant communities. These changes are often a sign of a changing climate.[96][97] As an example, pollen studies have been used to track changing vegetation patterns throughout the Quaternary glaciations[98] and especially since the last glacial maximum.[99] Remains of beetles are common in freshwater and land sediments. Different species of beetles tend to be found under different climatic conditions. Given the extensive lineage of beetles whose genetic makeup has not altered significantly over the millennia, knowledge of the present climatic range of the different species, and the age of the sediments in which remains are found, past climatic conditions may be inferred.[100]
Analysis and uncertainties
One difficulty in detecting climate cycles is that the Earth’s climate has been changing in non-cyclic ways over most paleoclimatological timescales. Currently we are in a period of anthropogenic global warming. In a larger timeframe, the Earth is emerging from the latest ice age, cooling from the Holocene climatic optimum and warming from the «Little Ice Age», which means that climate has been constantly changing over the last 15,000 years or so. During warm periods, temperature fluctuations are often of a lesser amplitude. The Pleistocene period, dominated by repeated glaciations, developed out of more stable conditions in the Miocene and Pliocene climate. Holocene climate has been relatively stable. All of these changes complicate the task of looking for cyclical behavior in the climate.
Positive feedback, negative feedback, and ecological inertia from the land-ocean-atmosphere system often attenuate or reverse smaller effects, whether from orbital forcings, solar variations or changes in concentrations of greenhouse gases. Certain feedbacks involving processes such as clouds are also uncertain; for contrails, natural cirrus clouds, oceanic dimethyl sulfide and a land-based equivalent, competing theories exist concerning effects on climatic temperatures, for example contrasting the Iris hypothesis and CLAW hypothesis.
Impacts
Life
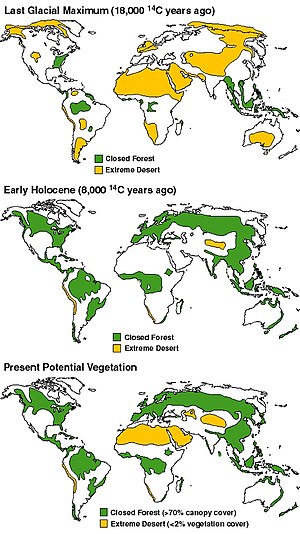
Top: Arid ice age climate
Middle: Atlantic Period, warm and wet
Bottom: Potential vegetation in climate now if not for human effects like agriculture.[101]
Vegetation
A change in the type, distribution and coverage of vegetation may occur given a change in the climate. Some changes in climate may result in increased precipitation and warmth, resulting in improved plant growth and the subsequent sequestration of airborne CO2. The effects are expected to affect the rate of many natural cycles like plant litter decomposition rates.[102] A gradual increase in warmth in a region will lead to earlier flowering and fruiting times, driving a change in the timing of life cycles of dependent organisms. Conversely, cold will cause plant bio-cycles to lag.[103]
Larger, faster or more radical changes, however, may result in vegetation stress, rapid plant loss and desertification in certain circumstances.[104][105] An example of this occurred during the Carboniferous Rainforest Collapse (CRC), an extinction event 300 million years ago. At this time vast rainforests covered the equatorial region of Europe and America. Climate change devastated these tropical rainforests, abruptly fragmenting the habitat into isolated ‘islands’ and causing the extinction of many plant and animal species.[104]
Wildlife
One of the most important ways animals can deal with climatic change is migration to warmer or colder regions.[106] On a longer timescale, evolution makes ecosystems including animals better adapted to a new climate.[107] Rapid or large climate change can cause mass extinctions when creatures are stretched too far to be able to adapt.[108]
Humanity
Collapses of past civilizations such as the Maya may be related to cycles of precipitation, especially drought, that in this example also correlates to the Western Hemisphere Warm Pool. Around 70 000 years ago the Toba supervolcano eruption created an especially cold period during the ice age, leading to a possible genetic bottleneck in human populations.
Changes in the cryosphere
Glaciers and ice sheets
Glaciers are considered among the most sensitive indicators of a changing climate.[109] Their size is determined by a mass balance between snow input and melt output. As temperatures increase, glaciers retreat unless snow precipitation increases to make up for the additional melt. Glaciers grow and shrink due both to natural variability and external forcings. Variability in temperature, precipitation and hydrology can strongly determine the evolution of a glacier in a particular season.
The most significant climate processes since the middle to late Pliocene (approximately 3 million years ago) are the glacial and interglacial cycles. The present interglacial period (the Holocene) has lasted about 11,700 years.[110] Shaped by orbital variations, responses such as the rise and fall of continental ice sheets and significant sea-level changes helped create the climate. Other changes, including Heinrich events, Dansgaard–Oeschger events and the Younger Dryas, however, illustrate how glacial variations may also influence climate without the orbital forcing.
Sea level change
During the Last Glacial Maximum, some 25,000 years ago, sea levels were roughly 130 m lower than today. The deglaciation afterwards was characterized by rapid sea level change.[111] In the early Pliocene, global temperatures were 1–2˚C warmer than the present temperature, yet sea level was 15–25 meters higher than today.[112]
Sea ice
Sea ice plays an important role in Earth’s climate as it affects the total amount of sunlight that is reflected away from the Earth.[113] In the past, the Earth’s oceans have been almost entirely covered by sea ice on a number of occasions, when the Earth was in a so-called Snowball Earth state,[114] and completely ice-free in periods of warm climate.[115] When there is a lot of sea ice present globally, especially in the tropics and subtropics, the climate is more sensitive to forcings as the ice–albedo feedback is very strong.[116]
Climate History
Various climate forcings are typically in flux throughout geologic time, and some processes of the Earth’s temperature may be self-regulating. For example, during the Snowball Earth period, large glacial ice sheets spanned to Earth’s equator, covering nearly its entire surface, and very high albedo created extremely low temperatures, while the accumulation of snow and ice likely removed carbon dioxide through atmospheric deposition. However, the absence of plant cover to absorb atmospheric CO2 emitted by volcanoes meant that the greenhouse gas could accumulate in the atmosphere. There was also an absence of exposed silicate rocks, which use CO2 when they undergo weathering. This created a warming that later melted the ice and brought Earth’s temperature back up.
Paleo-Eocene Thermal maximum

Climate changes over the past 65 million years, using proxy data including Oxygen-18 ratios from foraminifera.
The Paleocene–Eocene Thermal Maximum (PETM) was a time period with more than 5–8 °C global average temperature rise across the event.[117] This climate event occurred at the time boundary of the Paleocene and Eocene geological epochs.[118] During the event large amounts of methane was released, a potent greenhouse gas.[119] The PETM represents a «case study» for modern climate change as in the greenhouse gases were released in a geologically relatively short amount of time.[117] During the PETM, a mass extinction of organisms in the deep ocean took place.[120]
The Cenozoic
Throughout the Cenozoic, multiple climate forcings led to warming and cooling of the atmosphere, which led to the early formation of the Antarctic ice sheet, subsequent melting, and its later reglaciation. The temperature changes occurred somewhat suddenly, at carbon dioxide concentrations of about 600–760 ppm and temperatures approximately 4 °C warmer than today. During the Pleistocene, cycles of glaciations and interglacials occurred on cycles of roughly 100,000 years, but may stay longer within an interglacial when orbital eccentricity approaches zero, as during the current interglacial. Previous interglacials such as the Eemian phase created temperatures higher than today, higher sea levels, and some partial melting of the West Antarctic ice sheet.
Climatological temperatures substantially affect cloud cover and precipitation. At lower temperatures, air can hold less water vapour, which can lead to decreased precipitation.[121] During the Last Glacial Maximum of 18,000 years ago, thermal-driven evaporation from the oceans onto continental landmasses was low, causing large areas of extreme desert, including polar deserts (cold but with low rates of cloud cover and precipitation).[101] In contrast, the world’s climate was cloudier and wetter than today near the start of the warm Atlantic Period of 8000 years ago.[101]
The Holocene

Temperature change over the past 12 000 years, from various sources. The thick black curve is an average.
The Holocene is characterized by a long-term cooling starting after the Holocene Optimum, when temperatures were probably only just below current temperatures (second decade of the 21st century),[122] and a strong African Monsoon created grassland conditions in the Sahara during the Neolithic Subpluvial. Since that time, several cooling events have occurred, including:
- the Piora Oscillation
- the Middle Bronze Age Cold Epoch
- the Iron Age Cold Epoch
- the Little Ice Age
- the phase of cooling c. 1940–1970, which led to global cooling hypothesis
In contrast, several warm periods have also taken place, and they include but are not limited to:
- a warm period during the apex of the Minoan civilization
- the Roman Warm Period
- the Medieval Warm Period
- Modern warming during the 20th century
Certain effects have occurred during these cycles. For example, during the Medieval Warm Period, the American Midwest was in drought, including the Sand Hills of Nebraska which were active sand dunes. The black death plague of Yersinia pestis also occurred during Medieval temperature fluctuations, and may be related to changing climates.
Solar activity may have contributed to part of the modern warming that peaked in the 1930s. However, solar cycles fail to account for warming observed since the 1980s to the present day[citation needed]. Events such as the opening of the Northwest Passage and recent record low ice minima of the modern Arctic shrinkage have not taken place for at least several centuries, as early explorers were all unable to make an Arctic crossing, even in summer. Shifts in biomes and habitat ranges are also unprecedented, occurring at rates that do not coincide with known climate oscillations[citation needed].
Modern climate change and global warming
As a consequence of humans emitting greenhouse gases, global surface temperatures have started rising. Global warming is an aspect of modern climate change, a term that also includes the observed changes in precipitation, storm tracks and cloudiness. As a consequence, glaciers worldwide have been found to be shrinking significantly.[123][124] Land ice sheets in both Antarctica and Greenland have been losing mass since 2002 and have seen an acceleration of ice mass loss since 2009.[125] Global sea levels have been rising as a consequence of thermal expansion and ice melt. The decline in Arctic sea ice, both in extent and thickness, over the last several decades is further evidence for rapid climate change.[126]
Variability between regions
Examples of regional climate variability
-
![Land-ocean. Surface air temperatures over land masses have been increasing faster than those over the ocean,[127] the ocean absorbing about 90% of excess heat.[128]](data:image/svg+xml,%3Csvg%20xmlns='http://www.w3.org/2000/svg'%20viewBox='0%200%20211%20150'%3E%3C/svg%3E)
Land-ocean. Surface air temperatures over land masses have been increasing faster than those over the ocean,[127] the ocean absorbing about 90% of excess heat.[128]
-
![Hemispheres. The Hemispheres' average temperature changes[129] have diverged because of the North's greater percentage of landmass, and due to global ocean currents.[130]](data:image/svg+xml,%3Csvg%20xmlns='http://www.w3.org/2000/svg'%20viewBox='0%200%20209%20150'%3E%3C/svg%3E)
Hemispheres. The Hemispheres’ average temperature changes[129] have diverged because of the North’s greater percentage of landmass, and due to global ocean currents.[130]
-
![Latitude bands. Three latitude bands that respectively cover 30, 40 and 30 percent of the global surface area show mutually distinct temperature growth patterns in recent decades.[131]](data:image/svg+xml,%3Csvg%20xmlns='http://www.w3.org/2000/svg'%20viewBox='0%200%20234%20150'%3E%3C/svg%3E)
Latitude bands. Three latitude bands that respectively cover 30, 40 and 30 percent of the global surface area show mutually distinct temperature growth patterns in recent decades.[131]
-
![Altitude. A warming stripes graphic (blues denote cool, reds denote warm) shows how the greenhouse effect traps heat in the lower atmosphere so that the upper atmosphere, receiving less reflected energy, cools. Volcanos cause upper-atmosphere temperature spikes.[132]](data:image/svg+xml,%3Csvg%20xmlns='http://www.w3.org/2000/svg'%20viewBox='0%200%20259%20150'%3E%3C/svg%3E)
Altitude. A warming stripes graphic (blues denote cool, reds denote warm) shows how the greenhouse effect traps heat in the lower atmosphere so that the upper atmosphere, receiving less reflected energy, cools. Volcanos cause upper-atmosphere temperature spikes.[132]
-
Global versus regional. For geographical and statistical reasons, larger year-to-year variations are expected[133] for localized geographic regions (e.g., the Caribbean) than for global averages.[134]
-
![Relative deviation. Though northern America has warmed more than its tropics, the tropics have more clearly departed from normal historical variability (colored bands: 1σ, 2σ standard deviations).[135]](data:image/svg+xml,%3Csvg%20xmlns='http://www.w3.org/2000/svg'%20viewBox='0%200%20200%20150'%3E%3C/svg%3E)
Relative deviation. Though northern America has warmed more than its tropics, the tropics have more clearly departed from normal historical variability (colored bands: 1σ, 2σ standard deviations).[135]
![Land-ocean. Surface air temperatures over land masses have been increasing faster than those over the ocean,[127] the ocean absorbing about 90% of excess heat.[128]](https://upload.wikimedia.org/wikipedia/commons/thumb/5/50/Land_vs_Ocean_Temperature.svg/316px-Land_vs_Ocean_Temperature.svg.png)
![Hemispheres. The Hemispheres' average temperature changes[129] have diverged because of the North's greater percentage of landmass, and due to global ocean currents.[130]](https://upload.wikimedia.org/wikipedia/commons/thumb/f/fe/20200505_Global_warming_variability_-_Northern_vs_Southern_hemispheres.svg/313px-20200505_Global_warming_variability_-_Northern_vs_Southern_hemispheres.svg.png)
![Latitude bands. Three latitude bands that respectively cover 30, 40 and 30 percent of the global surface area show mutually distinct temperature growth patterns in recent decades.[131]](https://upload.wikimedia.org/wikipedia/commons/thumb/1/1b/20200314_Temperature_changes_for_three_latitude_bands_%285MA%2C_1880-_%29_GISS.svg/350px-20200314_Temperature_changes_for_three_latitude_bands_%285MA%2C_1880-_%29_GISS.svg.png)
![Altitude. A warming stripes graphic (blues denote cool, reds denote warm) shows how the greenhouse effect traps heat in the lower atmosphere so that the upper atmosphere, receiving less reflected energy, cools. Volcanos cause upper-atmosphere temperature spikes.[132]](https://upload.wikimedia.org/wikipedia/commons/thumb/7/77/20190912_Stacked_warming_stripes_-_atmospheric_layers_%28derived_from_Ed_Hawkins%29.png/388px-20190912_Stacked_warming_stripes_-_atmospheric_layers_%28derived_from_Ed_Hawkins%29.png)
![Global versus regional. For geographical and statistical reasons, larger year-to-year variations are expected[133] for localized geographic regions (e.g., the Caribbean) than for global averages.[134]](https://upload.wikimedia.org/wikipedia/commons/thumb/2/2b/20200505_Global_warming_variability_-_global_vs_Caribbean.svg/313px-20200505_Global_warming_variability_-_global_vs_Caribbean.svg.png)
![Relative deviation. Though northern America has warmed more than its tropics, the tropics have more clearly departed from normal historical variability (colored bands: 1σ, 2σ standard deviations).[135]](https://upload.wikimedia.org/wikipedia/commons/thumb/c/c5/20200509_Emergence_of_temperatures_from_range_of_normal_historical_variability_-_tropical_vs_northern_Americas_%28Hawkins%29.gif/300px-20200509_Emergence_of_temperatures_from_range_of_normal_historical_variability_-_tropical_vs_northern_Americas_%28Hawkins%29.gif)
Global warming has varied substantially by latitude, with the northernmost latitude zones experiencing the largest temperature increases.
In addition to global climate variability and global climate change over time, numerous climatic variations occur contemporaneously across different physical regions.
The oceans’ absorption of about 90% of excess heat has helped to cause land surface temperatures to grow more rapidly than sea surface temperatures.[128] The Northern Hemisphere, having a larger landmass-to-ocean ratio than the Southern Hemisphere, shows greater average temperature increases.[130] Variations across different latitude bands also reflect this divergence in average temperature increase, with the temperature increase of northern extratropics exceeding that of the tropics, which in turn exceeds that of the southern extratropics.[131]
Upper regions of the atmosphere have been cooling contemporaneously with a warming in the lower atmosphere, confirming the action of the greenhouse effect and ozone depletion.[132]
Observed regional climatic variations confirm predictions concerning ongoing changes, for example, by contrasting (smoother) year-to-year global variations with (more volatile) year-to-year variations in localized regions.[133] Conversely, comparing different regions’ warming patterns to their respective historical variabilities, allows the raw magnitudes of temperature changes to be placed in the perspective of what is normal variability for each region.[135]
Regional variability observations permit study of regionalized climate tipping points such as rainforest loss, ice sheet and sea ice melt, and permafrost thawing.[136] Such distinctions underlie research into a possible global cascade of tipping points.[136]
See also
- Climatological normal
- Anthropocene
Notes
- ^ America’s Climate Choices: Panel on Advancing the Science of Climate Change; National Research Council (2010). Advancing the Science of Climate Change. Washington, D.C.: The National Academies Press. ISBN 978-0-309-14588-6. Archived from the original on 29 May 2014.
(p1) … there is a strong, credible body of evidence, based on multiple lines of research, documenting that climate is changing and that these changes are in large part caused by human activities. While much remains to be learned, the core phenomenon, scientific questions, and hypotheses have been examined thoroughly and have stood firm in the face of serious scientific debate and careful evaluation of alternative explanations. (pp. 21–22) Some scientific conclusions or theories have been so thoroughly examined and tested, and supported by so many independent observations and results, that their likelihood of subsequently being found to be wrong is vanishingly small. Such conclusions and theories are then regarded as settled facts. This is the case for the conclusions that the Earth system is warming and that much of this warming is very likely due to human activities.
- ^ Rohli & Vega 2018, p. 274.
- ^ «The United Nations Framework Convention on Climate Change». 21 March 1994.
Climate change means a change of climate which is attributed directly or indirectly to human activity that alters the composition of the global atmosphere and which is in addition to natural climate variability observed over comparable time periods.
- ^ «What’s in a Name? Global Warming vs. Climate Change». NASA. Retrieved 23 July 2011.
- ^ a b Hulme, Mike (2016). «Concept of Climate Change, in: The International Encyclopedia of Geography». The International Encyclopedia of Geography. Wiley-Blackwell/Association of American Geographers (AAG): 1. Retrieved 16 May 2016.
- ^ Hsiung, Jane (November 1985). «Estimates of Global Oceanic Meridional Heat Transport». Journal of Physical Oceanography. 15 (11): 1405–13. Bibcode:1985JPO….15.1405H. doi:10.1175/1520-0485(1985)015<1405:EOGOMH>2.0.CO;2.
- ^ Vallis, Geoffrey K.; Farneti, Riccardo (October 2009). «Meridional energy transport in the coupled atmosphere–ocean system: scaling and numerical experiments». Quarterly Journal of the Royal Meteorological Society. 135 (644): 1643–60. Bibcode:2009QJRMS.135.1643V. doi:10.1002/qj.498. S2CID 122384001.
- ^ Trenberth, Kevin E.; et al. (2009). «Earth’s Global Energy Budget». Bulletin of the American Meteorological Society. 90 (3): 311–23. Bibcode:2009BAMS…90..311T. doi:10.1175/2008BAMS2634.1.
- ^ Smith, Ralph C. (2013). Uncertainty Quantification: Theory, Implementation, and Applications. Computational Science and Engineering. Vol. 12. SIAM. p. 23. ISBN 978-1611973228.
- ^ Cronin 2010, pp. 17–18
- ^ Ruddiman 2008, pp. 261–62.
- ^ Hasselmann, K. (1976). «Stochastic climate models Part I. Theory». Tellus. 28 (6): 473–85. Bibcode:1976Tell…28..473H. doi:10.1111/j.2153-3490.1976.tb00696.x. ISSN 2153-3490.
- ^ Liu, Zhengyu (14 October 2011). «Dynamics of Interdecadal Climate Variability: A Historical Perspective». Journal of Climate. 25 (6): 1963–95. doi:10.1175/2011JCLI3980.1. ISSN 0894-8755. S2CID 53953041.
- ^ a b Ruddiman 2008, p. 262.
- ^ Benzi R, Parisi G, Sutera A, Vulpiani A (1982). «Stochastic resonance in climatic change». Tellus. 34 (1): 10–6. Bibcode:1982Tell…34…10B. doi:10.1111/j.2153-3490.1982.tb01787.x.
- ^ Brown, Patrick T.; Li, Wenhong; Cordero, Eugene C.; Mauget, Steven A. (21 April 2015). «Comparing the model-simulated global warming signal to observations using empirical estimates of unforced noise». Scientific Reports. 5: 9957. Bibcode:2015NatSR…5E9957B. doi:10.1038/srep09957. ISSN 2045-2322. PMC 4404682. PMID 25898351.
- ^ Hasselmann, K. (1 December 1976). «Stochastic climate models Part I. Theory». Tellus. 28 (6): 473–85. Bibcode:1976TellA..28..473H. doi:10.1111/j.2153-3490.1976.tb00696.x. ISSN 2153-3490.
- ^ Meehl, Gerald A.; Hu, Aixue; Arblaster, Julie M.; Fasullo, John; Trenberth, Kevin E. (8 April 2013). «Externally Forced and Internally Generated Decadal Climate Variability Associated with the Interdecadal Pacific Oscillation». Journal of Climate. 26 (18): 7298–310. Bibcode:2013JCli…26.7298M. doi:10.1175/JCLI-D-12-00548.1. ISSN 0894-8755. OSTI 1565088. S2CID 16183172.
- ^ England, Matthew H.; McGregor, Shayne; Spence, Paul; Meehl, Gerald A.; Timmermann, Axel; Cai, Wenju; Gupta, Alex Sen; McPhaden, Michael J.; Purich, Ariaan (1 March 2014). «Recent intensification of wind-driven circulation in the Pacific and the ongoing warming hiatus». Nature Climate Change. 4 (3): 222–27. Bibcode:2014NatCC…4..222E. doi:10.1038/nclimate2106. ISSN 1758-678X.
- ^ Brown, Patrick T.; Li, Wenhong; Li, Laifang; Ming, Yi (28 July 2014). «Top-of-atmosphere radiative contribution to unforced decadal global temperature variability in climate models». Geophysical Research Letters. 41 (14): 2014GL060625. Bibcode:2014GeoRL..41.5175B. doi:10.1002/2014GL060625. hdl:10161/9167. ISSN 1944-8007. S2CID 16933795.
- ^ Palmer, M. D.; McNeall, D. J. (1 January 2014). «Internal variability of Earth’s energy budget simulated by CMIP5 climate models». Environmental Research Letters. 9 (3): 034016. Bibcode:2014ERL…..9c4016P. doi:10.1088/1748-9326/9/3/034016. ISSN 1748-9326.
- ^ «El Niño & Other Oscillations». Woods Hole Oceanographic Institution. Retrieved 6 April 2019.
- ^ Wang, Chunzai (2018). «A review of ENSO theories». National Science Review. 5 (6): 813–825. doi:10.1093/nsr/nwy104. ISSN 2095-5138.
- ^ Climate Prediction Center (19 December 2005). «ENSO FAQ: How often do El Niño and La Niña typically occur?». National Centers for Environmental Prediction. Archived from the original on 27 August 2009. Retrieved 26 July 2009.
- ^ Kevin Krajick. «Part of the Pacific Ocean Is Not Warming as Expected. Why». Columbia University Lamont-Doherty Earth Observatory. Retrieved 2 November 2022.
- ^ Aristos Georgiou. «Mystery Stretch of the Pacific Ocean Is Not Warming Like the Rest of the World’s Waters». Newsweek. Retrieved 2 November 2022.
- ^ «What is the MJO, and why do we care?». NOAA Climate.gov. Retrieved 6 April 2019.
- ^ National Center for Atmospheric Research. Climate Analysis Section. Archived 22 June 2006 at the Wayback Machine Retrieved on 7 June 2007.
- ^ Baldwin, M. P.; Gray, L. J.; Dunkerton, T. J.; Hamilton, K.; Haynes, P. H.; Randel, W. J.; Holton, J. R.; Alexander, M. J.; Hirota, I. (2001). «The quasi-biennial oscillation». Reviews of Geophysics. 39 (2): 179–229. Bibcode:2001RvGeo..39..179B. doi:10.1029/1999RG000073. S2CID 16727059.
- ^ Newman, Matthew; Alexander, Michael A.; Ault, Toby R.; Cobb, Kim M.; Deser, Clara; Di Lorenzo, Emanuele; Mantua, Nathan J.; Miller, Arthur J.; Minobe, Shoshiro (2016). «The Pacific Decadal Oscillation, Revisited». Journal of Climate. 29 (12): 4399–4427. Bibcode:2016JCli…29.4399N. doi:10.1175/JCLI-D-15-0508.1. ISSN 0894-8755. S2CID 4824093.
- ^ «Interdecadal Pacific Oscillation». NIWA. 19 January 2016. Retrieved 6 April 2019.
- ^ Kuijpers, Antoon; Bo Holm Jacobsen; Seidenkrantz, Marit-Solveig; Knudsen, Mads Faurschou (2011). «Tracking the Atlantic Multidecadal Oscillation through the last 8,000 years». Nature Communications. 2: 178–. Bibcode:2011NatCo…2..178K. doi:10.1038/ncomms1186. ISSN 2041-1723. PMC 3105344. PMID 21285956.
- ^ Skonieczny, C. (2 January 2019). «Monsoon-driven Saharan dust variability over the past 240,000 years». Science Advances. 5 (1): eaav1887. Bibcode:2019SciA….5.1887S. doi:10.1126/sciadv.aav1887. PMC 6314818. PMID 30613782.
- ^ Thompson, David. «Annular Modes — Introduction». Retrieved 11 February 2020.
- ^ Burroughs 2001, pp. 207–08.
- ^ Spracklen, D. V.; Bonn, B.; Carslaw, K. S. (2008). «Boreal forests, aerosols and the impacts on clouds and climate». Philosophical Transactions of the Royal Society A: Mathematical, Physical and Engineering Sciences. 366 (1885): 4613–26. Bibcode:2008RSPTA.366.4613S. doi:10.1098/rsta.2008.0201. PMID 18826917. S2CID 206156442.
- ^ Christner, B. C.; Morris, C. E.; Foreman, C. M.; Cai, R.; Sands, D. C. (2008). «Ubiquity of Biological Ice Nucleators in Snowfall» (PDF). Science. 319 (5867): 1214. Bibcode:2008Sci…319.1214C. doi:10.1126/science.1149757. PMID 18309078. S2CID 39398426. Archived (PDF) from the original on 5 March 2020.
- ^ Schwartzman, David W.; Volk, Tyler (1989). «Biotic enhancement of weathering and the habitability of Earth». Nature. 340 (6233): 457–60. Bibcode:1989Natur.340..457S. doi:10.1038/340457a0. S2CID 4314648.
- ^ Kopp, R.E.; Kirschvink, J.L.; Hilburn, I.A.; Nash, C.Z. (2005). «The Paleoproterozoic snowball Earth: A climate disaster triggered by the evolution of oxygenic photosynthesis». Proceedings of the National Academy of Sciences. 102 (32): 11131–36. Bibcode:2005PNAS..10211131K. doi:10.1073/pnas.0504878102. PMC 1183582. PMID 16061801.
- ^ Kasting, J.F.; Siefert, JL (2002). «Life and the Evolution of Earth’s Atmosphere». Science. 296 (5570): 1066–68. Bibcode:2002Sci…296.1066K. doi:10.1126/science.1071184. PMID 12004117. S2CID 37190778.
- ^ Mora, C.I.; Driese, S.G.; Colarusso, L. A. (1996). «Middle to Late Paleozoic Atmospheric CO2 Levels from Soil Carbonate and Organic Matter». Science. 271 (5252): 1105–07. Bibcode:1996Sci…271.1105M. doi:10.1126/science.271.5252.1105. S2CID 128479221.
- ^ Berner, R.A. (1999). «Atmospheric oxygen over Phanerozoic time». Proceedings of the National Academy of Sciences. 96 (20): 10955–57. Bibcode:1999PNAS…9610955B. doi:10.1073/pnas.96.20.10955. PMC 34224. PMID 10500106.
- ^ Bains, Santo; Norris, Richard D.; Corfield, Richard M.; Faul, Kristina L. (2000). «Termination of global warmth at the Palaeocene/Eocene boundary through productivity feedback». Nature. 407 (6801): 171–74. Bibcode:2000Natur.407..171B. doi:10.1038/35025035. PMID 11001051. S2CID 4419536.
- ^ Zachos, J.C.; Dickens, G.R. (2000). «An assessment of the biogeochemical feedback response to the climatic and chemical perturbations of the LPTM». GFF. 122: 188–89. doi:10.1080/11035890001221188. S2CID 129797785.
- ^ Speelman, E.N.; Van Kempen, M.M.L.; Barke, J.; Brinkhuis, H.; Reichart, G.J.; Smolders, A.J.P.; Roelofs, J.G.M.; Sangiorgi, F.; De Leeuw, J.W.; Lotter, A.F.; Sinninghe Damsté, J.S. (2009). «The Eocene Arctic Azolla bloom: Environmental conditions, productivity and carbon drawdown». Geobiology. 7 (2): 155–70. doi:10.1111/j.1472-4669.2009.00195.x. PMID 19323694. S2CID 13206343.
- ^ Brinkhuis, Henk; Schouten, Stefan; Collinson, Margaret E.; Sluijs, Appy; Sinninghe Damsté, Jaap S. Sinninghe; Dickens, Gerald R.; Huber, Matthew; Cronin, Thomas M.; Onodera, Jonaotaro; Takahashi, Kozo; Bujak, Jonathan P.; Stein, Ruediger; Van Der Burgh, Johan; Eldrett, James S.; Harding, Ian C.; Lotter, André F.; Sangiorgi, Francesca; Van Konijnenburg-Van Cittert, Han van Konijnenburg-van; De Leeuw, Jan W.; Matthiessen, Jens; Backman, Jan; Moran, Kathryn; Expedition 302, Scientists (2006). «Episodic fresh surface waters in the Eocene Arctic Ocean». Nature. 441 (7093): 606–09. Bibcode:2006Natur.441..606B. doi:10.1038/nature04692. hdl:11250/174278. PMID 16752440. S2CID 4412107.
- ^ Retallack, Gregory J. (2001). «Cenozoic Expansion of Grasslands and Climatic Cooling». The Journal of Geology. 109 (4): 407–26. Bibcode:2001JG….109..407R. doi:10.1086/320791. S2CID 15560105.
- ^ Dutton, Jan F.; Barron, Eric J. (1997). «Miocene to present vegetation changes: A possible piece of the Cenozoic cooling puzzle». Geology. 25 (1): 39. Bibcode:1997Geo….25…39D. doi:10.1130/0091-7613(1997)025<0039:MTPVCA>2.3.CO;2.
- ^ Cronin 2010, p. 17
- ^ «3. Are human activities causing climate change?». science.org.au. Australian Academy of Science. Retrieved 12 August 2017.
- ^ Antoaneta Yotova, ed. (2009). «Anthropogenic Climate Influences». Climate Change, Human Systems and Policy Volume I. Eolss Publishers. ISBN 978-1-905839-02-5.
- ^ Steinfeld, H.; P. Gerber; T. Wassenaar; V. Castel; M. Rosales; C. de Haan (2006). Livestock’s long shadow.
- ^ The Editorial Board (28 November 2015). «What the Paris Climate Meeting Must Do». The New York Times. Retrieved 28 November 2015.
- ^ «Volcanic Gases and Their Effects». U.S. Department of the Interior. 10 January 2006. Retrieved 21 January 2008.
- ^ «Human Activities Emit Way More Carbon Dioxide Than Do Volcanoes». American Geophysical Union. 14 June 2011. Retrieved 20 June 2011.
- ^ a b «Milankovitch Cycles and Glaciation». University of Montana. Archived from the original on 16 July 2011. Retrieved 2 April 2009.
- ^ Gale, Andrew S. (1989). «A Milankovitch scale for Cenomanian time». Terra Nova. 1 (5): 420–25. Bibcode:1989TeNov…1..420G. doi:10.1111/j.1365-3121.1989.tb00403.x.
- ^ «Same forces as today caused climate changes 1.4 billion years ago». sdu.dk. University of Denmark. Archived from the original on 12 March 2015.
- ^ a b van Nes, Egbert H.; Scheffer, Marten; Brovkin, Victor; Lenton, Timothy M.; Ye, Hao; Deyle, Ethan; Sugihara, George (2015). «Causal feedbacks in climate change». Nature Climate Change. 5 (5): 445–48. Bibcode:2015NatCC…5..445V. doi:10.1038/nclimate2568. ISSN 1758-6798.
- ^ Box 6.2: What Caused the Low Atmospheric Carbon Dioxide Concentrations During Glacial Times? Archived 8 January 2023 at the Wayback Machine in IPCC AR4 WG1 2007 .
- ^ a b Rohli & Vega 2018, p. 296.
- ^ Willson, Richard C.; Hudson, Hugh S. (1991). «The Sun’s luminosity over a complete solar cycle». Nature. 351 (6321): 42–44. Bibcode:1991Natur.351…42W. doi:10.1038/351042a0. S2CID 4273483.
- ^ Turner, T. Edward; Swindles, Graeme T.; Charman, Dan J.; Langdon, Peter G.; Morris, Paul J.; Booth, Robert K.; Parry, Lauren E.; Nichols, Jonathan E. (5 April 2016). «Solar cycles or random processes? Evaluating solar variability in Holocene climate records». Scientific Reports. 6 (1): 23961. doi:10.1038/srep23961. ISSN 2045-2322. PMC 4820721. PMID 27045989.
- ^ Ribas, Ignasi (February 2010). The Sun and stars as the primary energy input in planetary atmospheres. IAU Symposium 264 ‘Solar and Stellar Variability – Impact on Earth and Planets’. Proceedings of the International Astronomical Union. Vol. 264. pp. 3–18. arXiv:0911.4872. Bibcode:2010IAUS..264….3R. doi:10.1017/S1743921309992298.
- ^ a b Marty, B. (2006). «Water in the Early Earth». Reviews in Mineralogy and Geochemistry. 62 (1): 421–450. Bibcode:2006RvMG…62..421M. doi:10.2138/rmg.2006.62.18.
- ^ Watson, E.B.; Harrison, TM (2005). «Zircon Thermometer Reveals Minimum Melting Conditions on Earliest Earth». Science. 308 (5723): 841–44. Bibcode:2005Sci…308..841W. doi:10.1126/science.1110873. PMID 15879213. S2CID 11114317.
- ^ Hagemann, Steffen G.; Gebre-Mariam, Musie; Groves, David I. (1994). «Surface-water influx in shallow-level Archean lode-gold deposits in Western, Australia». Geology. 22 (12): 1067. Bibcode:1994Geo….22.1067H. doi:10.1130/0091-7613(1994)022<1067:SWIISL>2.3.CO;2.
- ^ Sagan, C.; G. Mullen (1972). «Earth and Mars: Evolution of Atmospheres and Surface Temperatures». Science. 177 (4043): 52–6. Bibcode:1972Sci…177…52S. doi:10.1126/science.177.4043.52. PMID 17756316. S2CID 12566286.
- ^ Sagan, C.; Chyba, C (1997). «The Early Faint Sun Paradox: Organic Shielding of Ultraviolet-Labile Greenhouse Gases». Science. 276 (5316): 1217–21. Bibcode:1997Sci…276.1217S. doi:10.1126/science.276.5316.1217. PMID 11536805.
- ^ Schröder, K.-P.; Connon Smith, Robert (2008), «Distant future of the Sun and Earth revisited», Monthly Notices of the Royal Astronomical Society, 386 (1): 155–63, arXiv:0801.4031, Bibcode:2008MNRAS.386..155S, doi:10.1111/j.1365-2966.2008.13022.x, S2CID 10073988
- ^ a b Miles, M.G.; Grainger, R.G.; Highwood, E.J. (2004). «The significance of volcanic eruption strength and frequency for climate». Quarterly Journal of the Royal Meteorological Society. 130 (602): 2361–76. Bibcode:2004QJRMS.130.2361M. doi:10.1256/qj.03.60. S2CID 53005926.
- ^ «Volcanic Gases and Climate Change Overview». usgs.gov. USGS. Retrieved 31 July 2014.
- ^ Annexes Archived 6 July 2019 at the Wayback Machine, in IPCC AR4 SYR 2008, p. 58.
- ^ Diggles, Michael (28 February 2005). «The Cataclysmic 1991 Eruption of Mount Pinatubo, Philippines». U.S. Geological Survey Fact Sheet 113-97. United States Geological Survey. Retrieved 8 October 2009.
- ^ Diggles, Michael. «The Cataclysmic 1991 Eruption of Mount Pinatubo, Philippines». usgs.gov. Retrieved 31 July 2014.
- ^ Oppenheimer, Clive (2003). «Climatic, environmental and human consequences of the largest known historic eruption: Tambora volcano (Indonesia) 1815». Progress in Physical Geography. 27 (2): 230–59. doi:10.1191/0309133303pp379ra. S2CID 131663534.
- ^ Black, Benjamin A.; Gibson, Sally A. (2019). «Deep Carbon and the Life Cycle of Large Igneous Provinces». Elements. 15 (5): 319–324. doi:10.2138/gselements.15.5.319.
- ^ Wignall, P (2001). «Large igneous provinces and mass extinctions». Earth-Science Reviews. 53 (1): 1–33. Bibcode:2001ESRv…53….1W. doi:10.1016/S0012-8252(00)00037-4.
- ^ Graf, H.-F.; Feichter, J.; Langmann, B. (1997). «Volcanic sulphur emissions: Estimates of source strength and its contribution to the global sulphate distribution». Journal of Geophysical Research: Atmospheres. 102 (D9): 10727–38. Bibcode:1997JGR…10210727G. doi:10.1029/96JD03265. hdl:21.11116/0000-0003-2CBB-A.
- ^ Forest, C.E.; Wolfe, J.A.; Molnar, P.; Emanuel, K.A. (1999). «Paleoaltimetry incorporating atmospheric physics and botanical estimates of paleoclimate». Geological Society of America Bulletin. 111 (4): 497–511. Bibcode:1999GSAB..111..497F. doi:10.1130/0016-7606(1999)111<0497:PIAPAB>2.3.CO;2. hdl:1721.1/10809.
- ^ «Panama: Isthmus that Changed the World». NASA Earth Observatory. Archived from the original on 2 August 2007. Retrieved 1 July 2008.
- ^ Haug, Gerald H.; Keigwin, Lloyd D. (22 March 2004). «How the Isthmus of Panama Put Ice in the Arctic». Oceanus. Woods Hole Oceanographic Institution. 42 (2). Retrieved 1 October 2013.
- ^ Bruckschen, Peter; Oesmanna, Susanne; Veizer, Ján (30 September 1999). «Isotope stratigraphy of the European Carboniferous: proxy signals for ocean chemistry, climate and tectonics». Chemical Geology. 161 (1–3): 127–63. Bibcode:1999ChGeo.161..127B. doi:10.1016/S0009-2541(99)00084-4.
- ^ Parrish, Judith T. (1993). «Climate of the Supercontinent Pangea». The Journal of Geology. The University of Chicago Press. 101 (2): 215–33. Bibcode:1993JG….101..215P. doi:10.1086/648217. JSTOR 30081148. S2CID 128757269.
- ^ Hausfather, Zeke (18 August 2017). «Explainer: Why the sun is not responsible for recent climate change». Carbon Brief. Retrieved 5 September 2019.
- ^ Pierce, J. R. (2017). «Cosmic rays, aerosols, clouds, and climate: Recent findings from the CLOUD experiment». Journal of Geophysical Research: Atmospheres. 122 (15): 8051–55. Bibcode:2017JGRD..122.8051P. doi:10.1002/2017JD027475. ISSN 2169-8996. S2CID 125580175.
- ^ Brugger, Julia; Feulner, Georg; Petri, Stefan (April 2017), «Severe environmental effects of Chicxulub impact imply key role in end-Cretaceous mass extinction», 19th EGU General Assembly, EGU2017, proceedings from the conference, 23–28 April 2017, vol. 19, Vienna, Austria, p. 17167, Bibcode:2017EGUGA..1917167B.
- ^ Burroughs 2001, p. 232.
- ^ Hadlington, Simon 9 (May 2013). «Mineral dust plays key role in cloud formation and chemistry». Chemistry World. Retrieved 5 September 2019.
- ^ Mahowald, Natalie; Albani, Samuel; Kok, Jasper F.; Engelstaeder, Sebastian; Scanza, Rachel; Ward, Daniel S.; Flanner, Mark G. (1 December 2014). «The size distribution of desert dust aerosols and its impact on the Earth system». Aeolian Research. 15: 53–71. Bibcode:2014AeoRe..15…53M. doi:10.1016/j.aeolia.2013.09.002. ISSN 1875-9637.
- ^ New, M.; Todd, M.; Hulme, M; Jones, P. (December 2001). «Review: Precipitation measurements and trends in the twentieth century». International Journal of Climatology. 21 (15): 1889–922. Bibcode:2001IJCli..21.1889N. doi:10.1002/joc.680. S2CID 56212756.
- ^ a b Demenocal, P.B. (2001). «Cultural Responses to Climate Change During the Late Holocene» (PDF). Science. 292 (5517): 667–73. Bibcode:2001Sci…292..667D. doi:10.1126/science.1059827. PMID 11303088. S2CID 18642937. Archived from the original (PDF) on 17 December 2008. Retrieved 28 August 2015.
- ^ Sindbaek, S.M. (2007). «Networks and nodal points: the emergence of towns in early Viking Age Scandinavia». Antiquity. 81 (311): 119–32. doi:10.1017/s0003598x00094886.
- ^ Dominic, F.; Burns, S.J.; Neff, U.; Mudulsee, M.; Mangina, A; Matter, A. (April 2004). «Palaeoclimatic interpretation of high-resolution oxygen isotope profiles derived from annually laminated speleothems from Southern Oman». Quaternary Science Reviews. 23 (7–8): 935–45. Bibcode:2004QSRv…23..935F. doi:10.1016/j.quascirev.2003.06.019.
- ^ Hughes, Malcolm K.; Swetnam, Thomas W.; Diaz, Henry F., eds. (2010). Dendroclimatology: progress and prospect. Developments in Paleoenvironmental Research. Vol. 11. New York: Springer Science & Business Media. ISBN 978-1-4020-4010-8.
- ^ Langdon, P.G.; Barber, K.E.; Lomas-Clarke, S.H.; Lomas-Clarke, S.H. (August 2004). «Reconstructing climate and environmental change in northern England through chironomid and pollen analyses: evidence from Talkin Tarn, Cumbria». Journal of Paleolimnology. 32 (2): 197–213. Bibcode:2004JPall..32..197L. doi:10.1023/B:JOPL.0000029433.85764.a5. S2CID 128561705.
- ^ Birks, H.H. (March 2003). «The importance of plant macrofossils in the reconstruction of Lateglacial vegetation and climate: examples from Scotland, western Norway, and Minnesota, US» (PDF). Quaternary Science Reviews. 22 (5–7): 453–73. Bibcode:2003QSRv…22..453B. doi:10.1016/S0277-3791(02)00248-2. hdl:1956/387. Archived from the original (PDF) on 11 June 2007. Retrieved 20 April 2018.
- ^ Miyoshi, N; Fujiki, Toshiyuki; Morita, Yoshimune (1999). «Palynology of a 250-m core from Lake Biwa: a 430,000-year record of glacial–interglacial vegetation change in Japan». Review of Palaeobotany and Palynology. 104 (3–4): 267–83. doi:10.1016/S0034-6667(98)00058-X.
- ^ Prentice, I. Colin; Bartlein, Patrick J; Webb, Thompson (1991). «Vegetation and Climate Change in Eastern North America Since the Last Glacial Maximum». Ecology. 72 (6): 2038–56. doi:10.2307/1941558. JSTOR 1941558.
- ^ Coope, G.R.; Lemdahl, G.; Lowe, J.J.; Walkling, A. (4 May 1999). «Temperature gradients in northern Europe during the last glacial – Holocene transition (14–9 14 C kyr BP) interpreted from coleopteran assemblages». Journal of Quaternary Science. 13 (5): 419–33. Bibcode:1998JQS….13..419C. doi:10.1002/(SICI)1099-1417(1998090)13:5<419::AID-JQS410>3.0.CO;2-D.
- ^ a b c Adams, J.M.; Faure, H., eds. (1997). «Global land environments since the last interglacial». Tennessee: Oak Ridge National Laboratory. Archived from the original on 16 January 2008. QEN members.
- ^ Ochoa-Hueso, R; Delgado-Baquerizo, N; King, PTA; Benham, M; Arca, V; Power, SA (2019). «Ecosystem type and resource quality are more important than global change drivers in regulating early stages of litter decomposition». Soil Biology and Biochemistry. 129: 144–52. doi:10.1016/j.soilbio.2018.11.009. S2CID 92606851.
- ^ Kinver, Mark (15 November 2011). «UK trees’ fruit ripening ’18 days earlier’«. Bbc.co.uk. Retrieved 1 November 2012.
- ^ a b Sahney, S.; Benton, M.J.; Falcon-Lang, H.J. (2010). «Rainforest collapse triggered Pennsylvanian tetrapod diversification in Euramerica» (PDF). Geology. 38 (12): 1079–82. Bibcode:2010Geo….38.1079S. doi:10.1130/G31182.1. Retrieved 27 November 2013.
- ^ Bachelet, D.; Neilson, R.; Lenihan, J. M.; Drapek, R.J. (2001). «Climate Change Effects on Vegetation Distribution and Carbon Budget in the United States». Ecosystems. 4 (3): 164–85. doi:10.1007/s10021-001-0002-7. S2CID 15526358.
- ^ Burroughs 2007, p. 273.
- ^ Millington, Rebecca; Cox, Peter M.; Moore, Jonathan R.; Yvon-Durocher, Gabriel (10 May 2019). «Modelling ecosystem adaptation and dangerous rates of global warming». Emerging Topics in Life Sciences. 3 (2): 221–31. doi:10.1042/ETLS20180113. hdl:10871/36988. ISSN 2397-8554. PMID 33523155. S2CID 150221323.
- ^ Burroughs 2007, p. 267.
- ^ Seiz, G.; N. Foppa (2007). The activities of the World Glacier Monitoring Service (WGMS) (PDF) (Report). Archived from the original (PDF) on 25 March 2009. Retrieved 21 June 2009.
- ^ «International Stratigraphic Chart». International Commission on Stratigraphy. 2008. Archived from the original on 15 October 2011. Retrieved 3 October 2011.
- ^ Burroughs 2007, p. 279.
- ^ Hansen, James. «Science Briefs: Earth’s Climate History». NASA GISS. Archived from the original on 24 July 2011. Retrieved 25 April 2013.
- ^ Belt, Simon T.; Cabedo-Sanz, Patricia; Smik, Lukas; et al. (2015). «Identification of paleo Arctic winter sea ice limits and the marginal ice zone: Optimised biomarker-based reconstructions of late Quaternary Arctic sea ice». Earth and Planetary Science Letters. 431: 127–39. Bibcode:2015E&PSL.431..127B. doi:10.1016/j.epsl.2015.09.020. hdl:10026.1/4335. ISSN 0012-821X.
- ^ Warren, Stephen G.; Voigt, Aiko; Tziperman, Eli; et al. (1 November 2017). «Snowball Earth climate dynamics and Cryogenian geology-geobiology». Science Advances. 3 (11): e1600983. Bibcode:2017SciA….3E0983H. doi:10.1126/sciadv.1600983. ISSN 2375-2548. PMC 5677351. PMID 29134193.
- ^ Caballero, R.; Huber, M. (2013). «State-dependent climate sensitivity in past warm climates and its implications for future climate projections». Proceedings of the National Academy of Sciences. 110 (35): 14162–67. Bibcode:2013PNAS..11014162C. doi:10.1073/pnas.1303365110. ISSN 0027-8424. PMC 3761583. PMID 23918397.
- ^ Hansen James; Sato Makiko; Russell Gary; Kharecha Pushker (2013). «Climate sensitivity, sea level and atmospheric carbon dioxide». Philosophical Transactions of the Royal Society A: Mathematical, Physical and Engineering Sciences. 371 (2001): 20120294. arXiv:1211.4846. Bibcode:2013RSPTA.37120294H. doi:10.1098/rsta.2012.0294. PMC 3785813. PMID 24043864.
- ^ a b McInherney, F.A..; Wing, S. (2011). «A perturbation of carbon cycle, climate, and biosphere with implications for the future». Annual Review of Earth and Planetary Sciences. 39: 489–516. Bibcode:2011AREPS..39..489M. doi:10.1146/annurev-earth-040610-133431.
- ^ Westerhold, T..; Röhl, U.; Raffi, I.; Fornaciari, E.; Monechi, S.; Reale, V.; Bowles, J.; Evans, H. F. (2008). «Astronomical calibration of the Paleocene time» (PDF). Palaeogeography, Palaeoclimatology, Palaeoecology. 257 (4): 377–403. Bibcode:2008PPP…257..377W. doi:10.1016/j.palaeo.2007.09.016. Archived (PDF) from the original on 9 August 2017.
- ^ Burroughs 2007, pp. 190–91.
- ^ Ivany, Linda C.; Pietsch, Carlie; Handley, John C.; Lockwood, Rowan; Allmon, Warren D.; Sessa, Jocelyn A. (1 September 2018). «Little lasting impact of the Paleocene-Eocene Thermal Maximum on shallow marine molluscan faunas». Science Advances. 4 (9): eaat5528. Bibcode:2018SciA….4.5528I. doi:10.1126/sciadv.aat5528. ISSN 2375-2548. PMC 6124918. PMID 30191179.
- ^ Haerter, Jan O.; Moseley, Christopher; Berg, Peter (2013). «Strong increase in convective precipitation in response to higher temperatures». Nature Geoscience. 6 (3): 181–85. Bibcode:2013NatGe…6..181B. doi:10.1038/ngeo1731. ISSN 1752-0908.
- ^ Kaufman, Darrell; McKay, Nicholas; Routson, Cody; Erb, Michael; Dätwyler, Christoph; Sommer, Philipp S.; Heiri, Oliver; Davis, Basil (30 June 2020). «Holocene global mean surface temperature, a multi-method reconstruction approach». Scientific Data. 7 (1): 201. Bibcode:2020NatSD…7..201K. doi:10.1038/s41597-020-0530-7. ISSN 2052-4463. PMC 7327079. PMID 32606396.
- ^ Zemp, M.; I.Roer; A.Kääb; M.Hoelzle; F.Paul; W. Haeberli (2008). United Nations Environment Programme – Global Glacier Changes: facts and figures (PDF) (Report). Archived from the original (PDF) on 25 March 2009. Retrieved 21 June 2009.
- ^ EPA, OA, US (July 2016). «Climate Change Indicators: Glaciers». US EPA.
- ^ «Land ice – NASA Global Climate Change».
- ^ Shaftel, Holly (ed.). «Climate Change: How do we know?». NASA Global Climate Change. Earth Science Communications Team at NASA’s Jet Propulsion Laboratory. Retrieved 16 December 2017.
- ^ «GISS Surface Temperature Analysis (v4) / Annual Mean Temperature Change over Land and over Ocean». NASA GISS. Archived from the original on 16 April 2020.
- ^ a b Harvey, Chelsea (1 November 2018). «The Oceans Are Heating Up Faster Than Expected». Scientific American. Archived from the original on 3 March 2020. Data from NASA GISS.
- ^ «GISS Surface Temperature Analysis (v4) / Annual Mean Temperature Change for Hemispheres». NASA GISS. Archived from the original on 16 April 2020.
- ^ a b Freedman, Andrew (9 April 2013). «In Warming, Northern Hemisphere is Outpacing the South». Climate Central. Archived from the original on 31 October 2019.
- ^ a b «GISS Surface Temperature Analysis (v4) / Temperature Change for Three Latitude Bands». NASA GISS. Archived from the original on 16 April 2020.
- ^ a b Hawkins, Ed (12 September 2019). «Atmospheric temperature trends». Climate Lab Book. Archived from the original on 12 September 2019. (Higher-altitude cooling differences attributed to ozone depletion and greenhouse gas increases; spikes occurred with volcanic eruptions of 1982-83 (El Chichón) and 1991-92 (Pinatubo).)
- ^ a b Meduna, Veronika (17 September 2018). «The climate visualisations that leave no room for doubt or denial». The Spinoff. New Zealand. Archived from the original on 17 May 2019.
- ^ «Climate at a Glance / Global Time Series». NCDC / NOAA. Archived from the original on 23 February 2020.
- ^ a b Hawkins, Ed (10 March 2020). «From the familiar to the unknown». Climate Lab Book (professional blog). Archived from the original on 23 April 2020. (Direct link to image; Hawkins credits Berkeley Earth for data.) «The emergence of observed temperature changes over both land and ocean is clearest in tropical regions, in contrast to the regions of largest change which are in the northern extra-tropics. As an illustration, northern America has warmed more than tropical America, but the changes in the tropics are more apparent and have more clearly emerged from the range of historical variability. The year-to-year variations in the higher latitudes have made it harder to distinguish the long-term changes.»
- ^ a b Lenton, Timothy M.; Rockström, Johan; Gaffney, Owen; Rahmstorf, Stefan; Richardson, Katherine; Steffen, Will; Schellnhuber, Hans Joachim (27 November 2019). «Climate tipping points — too risky to bet against». Nature. 575 (7784): 592–595. Bibcode:2019Natur.575..592L. doi:10.1038/d41586-019-03595-0. PMID 31776487. Correction dated 9 April 2020
References
- Cronin, Thomas N. (2010). Paleoclimates: understanding climate change past and present. New York: Columbia University Press. ISBN 978-0-231-14494-0.
- IPCC (2007). Solomon, S.; Qin, D.; Manning, M.; Chen, Z.; et al. (eds.). Climate Change 2007: The Physical Science Basis (PDF). Contribution of Working Group I to the Fourth Assessment Report of the Intergovernmental Panel on Climate Change. Cambridge University Press. ISBN 978-0-521-88009-1. (pb: 978-0-521-70596-7).
- IPCC (2008). The Core Writing Team; Pachauri, R.K.; Reisinger, A.R. (eds.). Climate Change 2008: Synthesis Report. Contribution of Working Groups I, II and III to the Fourth Assessment Report of the Intergovernmental Panel on Climate Change. Geneva, Switzerland: IPCC. ISBN 978-92-9169-122-7.[permanent dead link].
- Burroughs, William James (2001). Climate Change : A multidisciplinary approach. Cambridge: Cambridge university press. ISBN 0521567718.
- Burroughs, William James (2007). Climate Change : A multidisciplinary approach. Cambridge: Cambridge university press. ISBN 978-0-511-37027-4.
- Ruddiman, William F. (2008). Earth’s climate : Past and Future. New York: W. H. Freeman and Company. ISBN 9780716784906.
- Rohli, Robert. V.; Vega, Anthony J. (2018). Climatology (fourth ed.). Jones & Bartlett Learning. ISBN 9781284126563.
External links
- Global Climate Change from NASA (US)
- Intergovernmental Panel on Climate Change (IPCC)
- Climate Variability – NASA Science
- Climate Change and Variability, National Centers for Environmental Information Archived 21 September 2021 at the Wayback Machine
For the human-induced rise in Earth’s average temperature and its effects, see Climate change.
Climate variability includes all the variations in the climate that last longer than individual weather events, whereas the term climate change only refers to those variations that persist for a longer period of time, typically decades or more. Climate change may refer to any time in Earth’s history, but the term is now commonly used to describe contemporary climate change. Since the Industrial Revolution, the climate has increasingly been affected by human activities.[1]
The climate system receives nearly all of its energy from the sun and radiates energy to outer space. The balance of incoming and outgoing energy and the passage of the energy through the climate system is Earth’s energy budget. When the incoming energy is greater than the outgoing energy, Earth’s energy budget is positive and the climate system is warming. If more energy goes out, the energy budget is negative and Earth experiences cooling.
The energy moving through Earth’s climate system finds expression in weather, varying on geographic scales and time. Long-term averages and variability of weather in a region constitute the region’s climate. Such changes can be the result of «internal variability», when natural processes inherent to the various parts of the climate system alter the distribution of energy. Examples include variability in ocean basins such as the Pacific decadal oscillation and Atlantic multidecadal oscillation. Climate variability can also result from external forcing, when events outside of the climate system’s components produce changes within the system. Examples include changes in solar output and volcanism.
Climate variability has consequences for sea level changes, plant life, and mass extinctions; it also affects human societies.
Terminology
Climate variability is the term to describe variations in the mean state and other characteristics of climate (such as chances or possibility of extreme weather, etc.) «on all spatial and temporal scales beyond that of individual weather events.» Some of the variability does not appear to be caused by known systems and occurs at seemingly random times. Such variability is called random variability or noise. On the other hand, periodic variability occurs relatively regularly and in distinct modes of variability or climate patterns.[2]
The term climate change is often used to refer specifically to anthropogenic climate change (also known as global warming). Anthropogenic climate change is caused by human activity, as opposed to changes in climate that may have resulted as part of Earth’s natural processes.[3]
In this sense, the term climate change has become synonymous with anthropogenic global warming. Within scientific journals, global warming refers to surface temperature increases while climate change includes global warming and everything else that increasing greenhouse gas levels affect.[4]
A related term, climatic change, was proposed by the World Meteorological Organization (WMO) in 1966 to encompass all forms of climatic variability on time-scales longer than 10 years, but regardless of cause. During the 1970s, the term climate change replaced climatic change to focus on anthropogenic causes, as it became clear that human activities had a potential to drastically alter the climate.[5] Climate change was incorporated in the title of the Intergovernmental Panel on Climate Change (IPCC) and the UN Framework Convention on Climate Change (UNFCCC). Climate change is now used as both a technical description of the process, as well as a noun used to describe the problem.[5]
Causes
On the broadest scale, the rate at which energy is received from the Sun and the rate at which it is lost to space determine the equilibrium temperature and climate of Earth. This energy is distributed around the globe by winds, ocean currents,[6][7] and other mechanisms to affect the climates of different regions.[8]
Factors that can shape climate are called climate forcings or «forcing mechanisms».[9] These include processes such as variations in solar radiation, variations in the Earth’s orbit, variations in the albedo or reflectivity of the continents, atmosphere, and oceans, mountain-building and continental drift and changes in greenhouse gas concentrations. External forcing can be either anthropogenic (e.g. increased emissions of greenhouse gases and dust) or natural (e.g., changes in solar output, the Earth’s orbit, volcano eruptions).[10] There are a variety of climate change feedbacks that can either amplify or diminish the initial forcing. There are also key thresholds which when exceeded can produce rapid or irreversible change.
Some parts of the climate system, such as the oceans and ice caps, respond more slowly in reaction to climate forcings, while others respond more quickly. An example of fast change is the atmospheric cooling after a volcanic eruption, when volcanic ash reflects sunlight. Thermal expansion of ocean water after atmospheric warming is slow, and can take thousands of years. A combination is also possible, e.g., sudden loss of albedo in the Arctic Ocean as sea ice melts, followed by more gradual thermal expansion of the water.
Climate variability can also occur due to internal processes. Internal unforced processes often involve changes in the distribution of energy in the ocean and atmosphere, for instance, changes in the thermohaline circulation.
Internal variability
Climatic changes due to internal variability sometimes occur in cycles or oscillations. For other types of natural climatic change, we cannot predict when it happens; the change is called random or stochastic.[11] From a climate perspective, the weather can be considered random.[12] If there are little clouds in a particular year, there is an energy imbalance and extra heat can be absorbed by the oceans. Due to climate inertia, this signal can be ‘stored’ in the ocean and be expressed as variability on longer time scales than the original weather disturbances.[13] If the weather disturbances are completely random, occurring as white noise, the inertia of glaciers or oceans can transform this into climate changes where longer-duration oscillations are also larger oscillations, a phenomenon called red noise.[14] Many climate changes have a random aspect and a cyclical aspect. This behavior is dubbed stochastic resonance.[14] Half of the 2021 Nobel prize on physics was awarded for this work to Klaus Hasselmann jointly with Syukuro Manabe for related work on climate modelling. While Giorgio Parisi who with collaborators introduced[15] the concept of stochastic resonance was awarded the other half but mainly for work on theoretical physics.
Ocean-atmosphere variability
The ocean and atmosphere can work together to spontaneously generate internal climate variability that can persist for years to decades at a time.[16][17] These variations can affect global average surface temperature by redistributing heat between the deep ocean and the atmosphere[18][19] and/or by altering the cloud/water vapor/sea ice distribution which can affect the total energy budget of the Earth.[20][21]
Oscillations and cycles
A climate oscillation or climate cycle is any recurring cyclical oscillation within global or regional climate. They are quasiperiodic (not perfectly periodic), so a Fourier analysis of the data does not have sharp peaks in the spectrum. Many oscillations on different time-scales have been found or hypothesized:[22]
- the El Niño–Southern Oscillation (ENSO) – A large scale pattern of warmer (El Niño) and colder (La Niña) tropical sea surface temperatures in the Pacific Ocean with worldwide effects. It is a self-sustaining oscillation, whose mechanisms are well-studied.[23] ENSO is the most prominent known source of inter-annual variability in weather and climate around the world. The cycle occurs every two to seven years, with El Niño lasting nine months to two years within the longer term cycle.[24] The cold tongue of the equatorial Pacific Ocean is not warming as fast as the rest of the ocean, due to increased upwelling of cold waters off the west coast of South America.[25][26]
- the Madden–Julian oscillation (MJO) – An eastward moving pattern of increased rainfall over the tropics with a period of 30 to 60 days, observed mainly over the Indian and Pacific Oceans.[27]
- the North Atlantic oscillation (NAO) – Indices of the NAO are based on the difference of normalized sea-level pressure (SLP) between Ponta Delgada, Azores and Stykkishólmur/Reykjavík, Iceland. Positive values of the index indicate stronger-than-average westerlies over the middle latitudes.[28]
- the Quasi-biennial oscillation – a well-understood oscillation in wind patterns in the stratosphere around the equator. Over a period of 28 months the dominant wind changes from easterly to westerly and back.[29]
- Pacific Centennial Oscillation — a climate oscillation predicted by some climate models
- the Pacific decadal oscillation – The dominant pattern of sea surface variability in the North Pacific on a decadal scale. During a «warm», or «positive», phase, the west Pacific becomes cool and part of the eastern ocean warms; during a «cool» or «negative» phase, the opposite pattern occurs. It is thought not as a single phenomenon, but instead a combination of different physical processes.[30]
- the Interdecadal Pacific oscillation (IPO) – Basin wide variability in the Pacific Ocean with a period between 20 and 30 years.[31]
- the Atlantic multidecadal oscillation – A pattern of variability in the North Atlantic of about 55 to 70 years, with effects on rainfall, droughts and hurricane frequency and intensity.[32]
- North African climate cycles – climate variation driven by the North African Monsoon, with a period of tens of thousands of years.[33]
- the Arctic oscillation (AO) and Antarctic oscillation (AAO) – The annular modes are naturally occurring, hemispheric-wide patterns of climate variability. On timescales of weeks to months they explain 20-30% of the variability in their respective hemispheres. The Northern Annular Mode or Arctic oscillation (AO) in the Northern Hemisphere, and the Southern Annular Mode or Antarctic oscillation (AAO) in the southern hemisphere. The annular modes have a strong influence on the temperature and precipitation of mid-to-high latitude land masses, such as Europe and Australia, by altering the average paths of storms. The NAO can be considered a regional index of the AO/NAM.[34] They are defined as the first EOF of sea level pressure or geopotential height from 20°N to 90°N (NAM) or 20°S to 90°S (SAM).
- Dansgaard–Oeschger cycles – occurring on roughly 1,500-year cycles during the Last Glacial Maximum
Ocean current changes
A schematic of modern thermohaline circulation. Tens of millions of years ago, continental-plate movement formed a land-free gap around Antarctica, allowing the formation of the ACC, which keeps warm waters away from Antarctica.
The oceanic aspects of climate variability can generate variability on centennial timescales due to the ocean having hundreds of times more mass than in the atmosphere, and thus very high thermal inertia. For example, alterations to ocean processes such as thermohaline circulation play a key role in redistributing heat in the world’s oceans.
Ocean currents transport a lot of energy from the warm tropical regions to the colder polar regions. Changes occurring around the last ice age (in technical terms, the last glacial) show that the circulation is the North Atlantic can change suddenly and substantially, leading to global climate changes, even though the total amount of energy coming into the climate system didn’t change much. These large changes may have come from so called Heinrich events where internal instability of ice sheets caused huge ice bergs to be released into the ocean. When the ice sheet melts, the resulting water is very low in salt and cold, driving changes in circulation.[35]
Life
Life affects climate through its role in the carbon and water cycles and through such mechanisms as albedo, evapotranspiration, cloud formation, and weathering.[36][37][38] Examples of how life may have affected past climate include:
- glaciation 2.3 billion years ago triggered by the evolution of oxygenic photosynthesis, which depleted the atmosphere of the greenhouse gas carbon dioxide and introduced free oxygen[39][40]
- another glaciation 300 million years ago ushered in by long-term burial of decomposition-resistant detritus of vascular land-plants (creating a carbon sink and forming coal)[41][42]
- termination of the Paleocene–Eocene Thermal Maximum 55 million years ago by flourishing marine phytoplankton[43][44]
- reversal of global warming 49 million years ago by 800,000 years of arctic azolla blooms[45][46]
- global cooling over the past 40 million years driven by the expansion of grass-grazer ecosystems[47][48]
External climate forcing
Greenhouse gases
CO2 concentrations over the last 800,000 years as measured from ice cores (blue/green) and directly (black)
Whereas greenhouse gases released by the biosphere is often seen as a feedback or internal climate process, greenhouse gases emitted from volcanoes are typically classified as external by climatologists.[49] Greenhouse gases, such as CO2, methane and nitrous oxide, heat the climate system by trapping infrared light. Volcanoes are also part of the extended carbon cycle. Over very long (geological) time periods, they release carbon dioxide from the Earth’s crust and mantle, counteracting the uptake by sedimentary rocks and other geological carbon dioxide sinks.
Since the industrial revolution, humanity has been adding to greenhouse gases by emitting CO2 from fossil fuel combustion, changing land use through deforestation, and has further altered the climate with aerosols (particulate matter in the atmosphere),[50] release of trace gases (e.g. nitrogen oxides, carbon monoxide, or methane).[51] Other factors, including land use, ozone depletion, animal husbandry (ruminant animals such as cattle produce methane[52]), and deforestation, also play a role.[53]
The US Geological Survey estimates are that volcanic emissions are at a much lower level than the effects of current human activities, which generate 100–300 times the amount of carbon dioxide emitted by volcanoes.[54] The annual amount put out by human activities may be greater than the amount released by supereruptions, the most recent of which was the Toba eruption in Indonesia 74,000 years ago.[55]
Orbital variations
Milankovitch cycles from 800,000 years ago in the past to 800,000 years in the future.
Slight variations in Earth’s motion lead to changes in the seasonal distribution of sunlight reaching the Earth’s surface and how it is distributed across the globe. There is very little change to the area-averaged annually averaged sunshine; but there can be strong changes in the geographical and seasonal distribution. The three types of kinematic change are variations in Earth’s eccentricity, changes in the tilt angle of Earth’s axis of rotation, and precession of Earth’s axis. Combined, these produce Milankovitch cycles which affect climate and are notable for their correlation to glacial and interglacial periods,[56] their correlation with the advance and retreat of the Sahara,[56] and for their appearance in the stratigraphic record.[57][58]
During the glacial cycles, there was a high correlation between CO2 concentrations and temperatures. Early studies indicated that CO2 concentrations lagged temperatures, but it has become clear that this isn’t always the case.[59] When ocean temperatures increase, the solubility of CO2 decreases so that it is released from the ocean. The exchange of CO2 between the air and the ocean can also be impacted by further aspects of climatic change.[60] These and other self-reinforcing processes allow small changes in Earth’s motion to have a large effect on climate.[59]
Solar output
Variations in solar activity during the last several centuries based on observations of sunspots and beryllium isotopes. The period of extraordinarily few sunspots in the late 17th century was the Maunder minimum.
The Sun is the predominant source of energy input to the Earth’s climate system. Other sources include geothermal energy from the Earth’s core, tidal energy from the Moon and heat from the decay of radioactive compounds. Both long term variations in solar intensity are known to affect global climate.[61] Solar output varies on shorter time scales, including the 11-year solar cycle[62] and longer-term modulations.[63] Correlation between sunspots and climate and tenuous at best.[61]
Three to four billion years ago, the Sun emitted only 75% as much power as it does today.[64] If the atmospheric composition had been the same as today, liquid water should not have existed on the Earth’s surface. However, there is evidence for the presence of water on the early Earth, in the Hadean[65][66] and Archean[67][65] eons, leading to what is known as the faint young Sun paradox.[68] Hypothesized solutions to this paradox include a vastly different atmosphere, with much higher concentrations of greenhouse gases than currently exist.[69] Over the following approximately 4 billion years, the energy output of the Sun increased. Over the next five billion years, the Sun’s ultimate death as it becomes a red giant and then a white dwarf will have large effects on climate, with the red giant phase possibly ending any life on Earth that survives until that time.[70]
Volcanism
In atmospheric temperature from 1979 to 2010, determined by MSU NASA satellites, effects appear from aerosols released by major volcanic eruptions (El Chichón and Pinatubo). El Niño is a separate event, from ocean variability.
The eruptions considered to be large enough to affect the Earth’s climate on a scale of more than 1 year are the ones that inject over 100,000 tons of SO2 into the stratosphere.[71] This is due to the optical properties of SO2 and sulfate aerosols, which strongly absorb or scatter solar radiation, creating a global layer of sulfuric acid haze.[72] On average, such eruptions occur several times per century, and cause cooling (by partially blocking the transmission of solar radiation to the Earth’s surface) for a period of several years. Although volcanoes are technically part of the lithosphere, which itself is part of the climate system, the IPCC explicitly defines volcanism as an external forcing agent.[73]
Notable eruptions in the historical records are the 1991 eruption of Mount Pinatubo which lowered global temperatures by about 0.5 °C (0.9 °F) for up to three years,[74][75] and the 1815 eruption of Mount Tambora causing the Year Without a Summer.[76]
At a larger scale—a few times every 50 million to 100 million years—the eruption of large igneous provinces brings large quantities of igneous rock from the mantle and lithosphere to the Earth’s surface. Carbon dioxide in the rock is then released into the atmosphere.[77]
[78] Small eruptions, with injections of less than 0.1 Mt of sulfur dioxide into the stratosphere, affect the atmosphere only subtly, as temperature changes are comparable with natural variability. However, because smaller eruptions occur at a much higher frequency, they too significantly affect Earth’s atmosphere.[71][79]
Plate tectonics
Over the course of millions of years, the motion of tectonic plates reconfigures global land and ocean areas and generates topography. This can affect both global and local patterns of climate and atmosphere-ocean circulation.[80]
The position of the continents determines the geometry of the oceans and therefore influences patterns of ocean circulation. The locations of the seas are important in controlling the transfer of heat and moisture across the globe, and therefore, in determining global climate. A recent example of tectonic control on ocean circulation is the formation of the Isthmus of Panama about 5 million years ago, which shut off direct mixing between the Atlantic and Pacific Oceans. This strongly affected the ocean dynamics of what is now the Gulf Stream and may have led to Northern Hemisphere ice cover.[81][82] During the Carboniferous period, about 300 to 360 million years ago, plate tectonics may have triggered large-scale storage of carbon and increased glaciation.[83] Geologic evidence points to a «megamonsoonal» circulation pattern during the time of the supercontinent Pangaea, and climate modeling suggests that the existence of the supercontinent was conducive to the establishment of monsoons.[84]
The size of continents is also important. Because of the stabilizing effect of the oceans on temperature, yearly temperature variations are generally lower in coastal areas than they are inland. A larger supercontinent will therefore have more area in which climate is strongly seasonal than will several smaller continents or islands.
Other mechanisms
It has been postulated that ionized particles known as cosmic rays could impact cloud cover and thereby the climate. As the sun shields the Earth from these particles, changes in solar activity were hypothesized to influence climate indirectly as well. To test the hypothesis, CERN designed the CLOUD experiment, which showed the effect of cosmic rays is too weak to influence climate noticeably.[85][86]
Evidence exists that the Chicxulub asteroid impact some 66 million years ago had severely affected the Earth’s climate. Large quantities of sulfate aerosols were kicked up into the atmosphere, decreasing global temperatures by up to 26 °C and producing sub-freezing temperatures for a period of 3–16 years. The recovery time for this event took more than 30 years.[87] The large-scale use of nuclear weapons has also been investigated for its impact on the climate. The hypothesis is that soot released by large-scale fires blocks a significant fraction of sunlight for as much as a year, leading to a sharp drop in temperatures for a few years. This possible event is described as nuclear winter.[88]
Humans’ use of land impact how much sunlight the surface reflects and the concentration of dust. Cloud formation is not only influenced by how much water is in the air and the temperature, but also by the amount of aerosols in the air such as dust.[89] Globally, more dust is available if there are many regions with dry soils, little vegetation and strong winds.[90]
Evidence and measurement of climate changes
Paleoclimatology is the study of changes in climate through the entire history of Earth. It uses a variety of proxy methods from the Earth and life sciences to obtain data preserved within things such as rocks, sediments, ice sheets, tree rings, corals, shells, and microfossils. It then uses the records to determine the past states of the Earth’s various climate regions and its atmospheric system. Direct measurements give a more complete overview of climate variability.
Direct measurements
Climate changes that occurred after the widespread deployment of measuring devices can be observed directly. Reasonably complete global records of surface temperature are available beginning from the mid-late 19th century. Further observations are derived indirectly from historical documents. Satellite cloud and precipitation data has been available since the 1970s.[91]
Historical climatology is the study of historical changes in climate and their effect on human history and development. The primary sources include written records such as sagas, chronicles, maps and local history literature as well as pictorial representations such as paintings, drawings and even rock art. Climate variability in the recent past may be derived from changes in settlement and agricultural patterns.[92] Archaeological evidence, oral history and historical documents can offer insights into past changes in the climate. Changes in climate have been linked to the rise[93] and the collapse of various civilizations.[92]
Proxy measurements
Variations in CO2, temperature and dust from the Vostok ice core over the last 450,000 years.
Various archives of past climate are present in rocks, trees and fossils. From these archives, indirect measures of climate, so-called proxies, can be derived. Quantification of climatological variation of precipitation in prior centuries and epochs is less complete but approximated using proxies such as marine sediments, ice cores, cave stalagmites, and tree rings.[94] Stress, too little precipitation or unsuitable temperatures, can alter the growth rate of trees, which allows scientists to infer climate trends by analyzing the growth rate of tree rings. This branch of science studying this called dendroclimatology.[95] Glaciers leave behind moraines that contain a wealth of material—including organic matter, quartz, and potassium that may be dated—recording the periods in which a glacier advanced and retreated.
Analysis of ice in cores drilled from an ice sheet such as the Antarctic ice sheet, can be used to show a link between temperature and global sea level variations. The air trapped in bubbles in the ice can also reveal the CO2 variations of the atmosphere from the distant past, well before modern environmental influences. The study of these ice cores has been a significant indicator of the changes in CO2 over many millennia, and continues to provide valuable information about the differences between ancient and modern atmospheric conditions. The 18O/16O ratio in calcite and ice core samples used to deduce ocean temperature in the distant past is an example of a temperature proxy method.
The remnants of plants, and specifically pollen, are also used to study climatic change. Plant distributions vary under different climate conditions. Different groups of plants have pollen with distinctive shapes and surface textures, and since the outer surface of pollen is composed of a very resilient material, they resist decay. Changes in the type of pollen found in different layers of sediment indicate changes in plant communities. These changes are often a sign of a changing climate.[96][97] As an example, pollen studies have been used to track changing vegetation patterns throughout the Quaternary glaciations[98] and especially since the last glacial maximum.[99] Remains of beetles are common in freshwater and land sediments. Different species of beetles tend to be found under different climatic conditions. Given the extensive lineage of beetles whose genetic makeup has not altered significantly over the millennia, knowledge of the present climatic range of the different species, and the age of the sediments in which remains are found, past climatic conditions may be inferred.[100]
Analysis and uncertainties
One difficulty in detecting climate cycles is that the Earth’s climate has been changing in non-cyclic ways over most paleoclimatological timescales. Currently we are in a period of anthropogenic global warming. In a larger timeframe, the Earth is emerging from the latest ice age, cooling from the Holocene climatic optimum and warming from the «Little Ice Age», which means that climate has been constantly changing over the last 15,000 years or so. During warm periods, temperature fluctuations are often of a lesser amplitude. The Pleistocene period, dominated by repeated glaciations, developed out of more stable conditions in the Miocene and Pliocene climate. Holocene climate has been relatively stable. All of these changes complicate the task of looking for cyclical behavior in the climate.
Positive feedback, negative feedback, and ecological inertia from the land-ocean-atmosphere system often attenuate or reverse smaller effects, whether from orbital forcings, solar variations or changes in concentrations of greenhouse gases. Certain feedbacks involving processes such as clouds are also uncertain; for contrails, natural cirrus clouds, oceanic dimethyl sulfide and a land-based equivalent, competing theories exist concerning effects on climatic temperatures, for example contrasting the Iris hypothesis and CLAW hypothesis.
Impacts
Life
Top: Arid ice age climate
Middle: Atlantic Period, warm and wet
Bottom: Potential vegetation in climate now if not for human effects like agriculture.[101]
Vegetation
A change in the type, distribution and coverage of vegetation may occur given a change in the climate. Some changes in climate may result in increased precipitation and warmth, resulting in improved plant growth and the subsequent sequestration of airborne CO2. The effects are expected to affect the rate of many natural cycles like plant litter decomposition rates.[102] A gradual increase in warmth in a region will lead to earlier flowering and fruiting times, driving a change in the timing of life cycles of dependent organisms. Conversely, cold will cause plant bio-cycles to lag.[103]
Larger, faster or more radical changes, however, may result in vegetation stress, rapid plant loss and desertification in certain circumstances.[104][105] An example of this occurred during the Carboniferous Rainforest Collapse (CRC), an extinction event 300 million years ago. At this time vast rainforests covered the equatorial region of Europe and America. Climate change devastated these tropical rainforests, abruptly fragmenting the habitat into isolated ‘islands’ and causing the extinction of many plant and animal species.[104]
Wildlife
One of the most important ways animals can deal with climatic change is migration to warmer or colder regions.[106] On a longer timescale, evolution makes ecosystems including animals better adapted to a new climate.[107] Rapid or large climate change can cause mass extinctions when creatures are stretched too far to be able to adapt.[108]
Humanity
Collapses of past civilizations such as the Maya may be related to cycles of precipitation, especially drought, that in this example also correlates to the Western Hemisphere Warm Pool. Around 70 000 years ago the Toba supervolcano eruption created an especially cold period during the ice age, leading to a possible genetic bottleneck in human populations.
Changes in the cryosphere
Glaciers and ice sheets
Glaciers are considered among the most sensitive indicators of a changing climate.[109] Their size is determined by a mass balance between snow input and melt output. As temperatures increase, glaciers retreat unless snow precipitation increases to make up for the additional melt. Glaciers grow and shrink due both to natural variability and external forcings. Variability in temperature, precipitation and hydrology can strongly determine the evolution of a glacier in a particular season.
The most significant climate processes since the middle to late Pliocene (approximately 3 million years ago) are the glacial and interglacial cycles. The present interglacial period (the Holocene) has lasted about 11,700 years.[110] Shaped by orbital variations, responses such as the rise and fall of continental ice sheets and significant sea-level changes helped create the climate. Other changes, including Heinrich events, Dansgaard–Oeschger events and the Younger Dryas, however, illustrate how glacial variations may also influence climate without the orbital forcing.
Sea level change
During the Last Glacial Maximum, some 25,000 years ago, sea levels were roughly 130 m lower than today. The deglaciation afterwards was characterized by rapid sea level change.[111] In the early Pliocene, global temperatures were 1–2˚C warmer than the present temperature, yet sea level was 15–25 meters higher than today.[112]
Sea ice
Sea ice plays an important role in Earth’s climate as it affects the total amount of sunlight that is reflected away from the Earth.[113] In the past, the Earth’s oceans have been almost entirely covered by sea ice on a number of occasions, when the Earth was in a so-called Snowball Earth state,[114] and completely ice-free in periods of warm climate.[115] When there is a lot of sea ice present globally, especially in the tropics and subtropics, the climate is more sensitive to forcings as the ice–albedo feedback is very strong.[116]
Climate History
Various climate forcings are typically in flux throughout geologic time, and some processes of the Earth’s temperature may be self-regulating. For example, during the Snowball Earth period, large glacial ice sheets spanned to Earth’s equator, covering nearly its entire surface, and very high albedo created extremely low temperatures, while the accumulation of snow and ice likely removed carbon dioxide through atmospheric deposition. However, the absence of plant cover to absorb atmospheric CO2 emitted by volcanoes meant that the greenhouse gas could accumulate in the atmosphere. There was also an absence of exposed silicate rocks, which use CO2 when they undergo weathering. This created a warming that later melted the ice and brought Earth’s temperature back up.
Paleo-Eocene Thermal maximum
Climate changes over the past 65 million years, using proxy data including Oxygen-18 ratios from foraminifera.
The Paleocene–Eocene Thermal Maximum (PETM) was a time period with more than 5–8 °C global average temperature rise across the event.[117] This climate event occurred at the time boundary of the Paleocene and Eocene geological epochs.[118] During the event large amounts of methane was released, a potent greenhouse gas.[119] The PETM represents a «case study» for modern climate change as in the greenhouse gases were released in a geologically relatively short amount of time.[117] During the PETM, a mass extinction of organisms in the deep ocean took place.[120]
The Cenozoic
Throughout the Cenozoic, multiple climate forcings led to warming and cooling of the atmosphere, which led to the early formation of the Antarctic ice sheet, subsequent melting, and its later reglaciation. The temperature changes occurred somewhat suddenly, at carbon dioxide concentrations of about 600–760 ppm and temperatures approximately 4 °C warmer than today. During the Pleistocene, cycles of glaciations and interglacials occurred on cycles of roughly 100,000 years, but may stay longer within an interglacial when orbital eccentricity approaches zero, as during the current interglacial. Previous interglacials such as the Eemian phase created temperatures higher than today, higher sea levels, and some partial melting of the West Antarctic ice sheet.
Climatological temperatures substantially affect cloud cover and precipitation. At lower temperatures, air can hold less water vapour, which can lead to decreased precipitation.[121] During the Last Glacial Maximum of 18,000 years ago, thermal-driven evaporation from the oceans onto continental landmasses was low, causing large areas of extreme desert, including polar deserts (cold but with low rates of cloud cover and precipitation).[101] In contrast, the world’s climate was cloudier and wetter than today near the start of the warm Atlantic Period of 8000 years ago.[101]
The Holocene
Temperature change over the past 12 000 years, from various sources. The thick black curve is an average.
The Holocene is characterized by a long-term cooling starting after the Holocene Optimum, when temperatures were probably only just below current temperatures (second decade of the 21st century),[122] and a strong African Monsoon created grassland conditions in the Sahara during the Neolithic Subpluvial. Since that time, several cooling events have occurred, including:
- the Piora Oscillation
- the Middle Bronze Age Cold Epoch
- the Iron Age Cold Epoch
- the Little Ice Age
- the phase of cooling c. 1940–1970, which led to global cooling hypothesis
In contrast, several warm periods have also taken place, and they include but are not limited to:
- a warm period during the apex of the Minoan civilization
- the Roman Warm Period
- the Medieval Warm Period
- Modern warming during the 20th century
Certain effects have occurred during these cycles. For example, during the Medieval Warm Period, the American Midwest was in drought, including the Sand Hills of Nebraska which were active sand dunes. The black death plague of Yersinia pestis also occurred during Medieval temperature fluctuations, and may be related to changing climates.
Solar activity may have contributed to part of the modern warming that peaked in the 1930s. However, solar cycles fail to account for warming observed since the 1980s to the present day[citation needed]. Events such as the opening of the Northwest Passage and recent record low ice minima of the modern Arctic shrinkage have not taken place for at least several centuries, as early explorers were all unable to make an Arctic crossing, even in summer. Shifts in biomes and habitat ranges are also unprecedented, occurring at rates that do not coincide with known climate oscillations[citation needed].
Modern climate change and global warming
As a consequence of humans emitting greenhouse gases, global surface temperatures have started rising. Global warming is an aspect of modern climate change, a term that also includes the observed changes in precipitation, storm tracks and cloudiness. As a consequence, glaciers worldwide have been found to be shrinking significantly.[123][124] Land ice sheets in both Antarctica and Greenland have been losing mass since 2002 and have seen an acceleration of ice mass loss since 2009.[125] Global sea levels have been rising as a consequence of thermal expansion and ice melt. The decline in Arctic sea ice, both in extent and thickness, over the last several decades is further evidence for rapid climate change.[126]
Variability between regions
Examples of regional climate variability
-
Land-ocean. Surface air temperatures over land masses have been increasing faster than those over the ocean,[127] the ocean absorbing about 90% of excess heat.[128]
-
Hemispheres. The Hemispheres’ average temperature changes[129] have diverged because of the North’s greater percentage of landmass, and due to global ocean currents.[130]
-
Latitude bands. Three latitude bands that respectively cover 30, 40 and 30 percent of the global surface area show mutually distinct temperature growth patterns in recent decades.[131]
-
Altitude. A warming stripes graphic (blues denote cool, reds denote warm) shows how the greenhouse effect traps heat in the lower atmosphere so that the upper atmosphere, receiving less reflected energy, cools. Volcanos cause upper-atmosphere temperature spikes.[132]
-
Global versus regional. For geographical and statistical reasons, larger year-to-year variations are expected[133] for localized geographic regions (e.g., the Caribbean) than for global averages.[134]
-
Relative deviation. Though northern America has warmed more than its tropics, the tropics have more clearly departed from normal historical variability (colored bands: 1σ, 2σ standard deviations).[135]
Global warming has varied substantially by latitude, with the northernmost latitude zones experiencing the largest temperature increases.
In addition to global climate variability and global climate change over time, numerous climatic variations occur contemporaneously across different physical regions.
The oceans’ absorption of about 90% of excess heat has helped to cause land surface temperatures to grow more rapidly than sea surface temperatures.[128] The Northern Hemisphere, having a larger landmass-to-ocean ratio than the Southern Hemisphere, shows greater average temperature increases.[130] Variations across different latitude bands also reflect this divergence in average temperature increase, with the temperature increase of northern extratropics exceeding that of the tropics, which in turn exceeds that of the southern extratropics.[131]
Upper regions of the atmosphere have been cooling contemporaneously with a warming in the lower atmosphere, confirming the action of the greenhouse effect and ozone depletion.[132]
Observed regional climatic variations confirm predictions concerning ongoing changes, for example, by contrasting (smoother) year-to-year global variations with (more volatile) year-to-year variations in localized regions.[133] Conversely, comparing different regions’ warming patterns to their respective historical variabilities, allows the raw magnitudes of temperature changes to be placed in the perspective of what is normal variability for each region.[135]
Regional variability observations permit study of regionalized climate tipping points such as rainforest loss, ice sheet and sea ice melt, and permafrost thawing.[136] Such distinctions underlie research into a possible global cascade of tipping points.[136]
See also
- Climatological normal
- Anthropocene
Notes
- ^ America’s Climate Choices: Panel on Advancing the Science of Climate Change; National Research Council (2010). Advancing the Science of Climate Change. Washington, D.C.: The National Academies Press. ISBN 978-0-309-14588-6. Archived from the original on 29 May 2014.
(p1) … there is a strong, credible body of evidence, based on multiple lines of research, documenting that climate is changing and that these changes are in large part caused by human activities. While much remains to be learned, the core phenomenon, scientific questions, and hypotheses have been examined thoroughly and have stood firm in the face of serious scientific debate and careful evaluation of alternative explanations. (pp. 21–22) Some scientific conclusions or theories have been so thoroughly examined and tested, and supported by so many independent observations and results, that their likelihood of subsequently being found to be wrong is vanishingly small. Such conclusions and theories are then regarded as settled facts. This is the case for the conclusions that the Earth system is warming and that much of this warming is very likely due to human activities.
- ^ Rohli & Vega 2018, p. 274.
- ^ «The United Nations Framework Convention on Climate Change». 21 March 1994.
Climate change means a change of climate which is attributed directly or indirectly to human activity that alters the composition of the global atmosphere and which is in addition to natural climate variability observed over comparable time periods.
- ^ «What’s in a Name? Global Warming vs. Climate Change». NASA. Retrieved 23 July 2011.
- ^ a b Hulme, Mike (2016). «Concept of Climate Change, in: The International Encyclopedia of Geography». The International Encyclopedia of Geography. Wiley-Blackwell/Association of American Geographers (AAG): 1. Retrieved 16 May 2016.
- ^ Hsiung, Jane (November 1985). «Estimates of Global Oceanic Meridional Heat Transport». Journal of Physical Oceanography. 15 (11): 1405–13. Bibcode:1985JPO….15.1405H. doi:10.1175/1520-0485(1985)015<1405:EOGOMH>2.0.CO;2.
- ^ Vallis, Geoffrey K.; Farneti, Riccardo (October 2009). «Meridional energy transport in the coupled atmosphere–ocean system: scaling and numerical experiments». Quarterly Journal of the Royal Meteorological Society. 135 (644): 1643–60. Bibcode:2009QJRMS.135.1643V. doi:10.1002/qj.498. S2CID 122384001.
- ^ Trenberth, Kevin E.; et al. (2009). «Earth’s Global Energy Budget». Bulletin of the American Meteorological Society. 90 (3): 311–23. Bibcode:2009BAMS…90..311T. doi:10.1175/2008BAMS2634.1.
- ^ Smith, Ralph C. (2013). Uncertainty Quantification: Theory, Implementation, and Applications. Computational Science and Engineering. Vol. 12. SIAM. p. 23. ISBN 978-1611973228.
- ^ Cronin 2010, pp. 17–18
- ^ Ruddiman 2008, pp. 261–62.
- ^ Hasselmann, K. (1976). «Stochastic climate models Part I. Theory». Tellus. 28 (6): 473–85. Bibcode:1976Tell…28..473H. doi:10.1111/j.2153-3490.1976.tb00696.x. ISSN 2153-3490.
- ^ Liu, Zhengyu (14 October 2011). «Dynamics of Interdecadal Climate Variability: A Historical Perspective». Journal of Climate. 25 (6): 1963–95. doi:10.1175/2011JCLI3980.1. ISSN 0894-8755. S2CID 53953041.
- ^ a b Ruddiman 2008, p. 262.
- ^ Benzi R, Parisi G, Sutera A, Vulpiani A (1982). «Stochastic resonance in climatic change». Tellus. 34 (1): 10–6. Bibcode:1982Tell…34…10B. doi:10.1111/j.2153-3490.1982.tb01787.x.
- ^ Brown, Patrick T.; Li, Wenhong; Cordero, Eugene C.; Mauget, Steven A. (21 April 2015). «Comparing the model-simulated global warming signal to observations using empirical estimates of unforced noise». Scientific Reports. 5: 9957. Bibcode:2015NatSR…5E9957B. doi:10.1038/srep09957. ISSN 2045-2322. PMC 4404682. PMID 25898351.
- ^ Hasselmann, K. (1 December 1976). «Stochastic climate models Part I. Theory». Tellus. 28 (6): 473–85. Bibcode:1976TellA..28..473H. doi:10.1111/j.2153-3490.1976.tb00696.x. ISSN 2153-3490.
- ^ Meehl, Gerald A.; Hu, Aixue; Arblaster, Julie M.; Fasullo, John; Trenberth, Kevin E. (8 April 2013). «Externally Forced and Internally Generated Decadal Climate Variability Associated with the Interdecadal Pacific Oscillation». Journal of Climate. 26 (18): 7298–310. Bibcode:2013JCli…26.7298M. doi:10.1175/JCLI-D-12-00548.1. ISSN 0894-8755. OSTI 1565088. S2CID 16183172.
- ^ England, Matthew H.; McGregor, Shayne; Spence, Paul; Meehl, Gerald A.; Timmermann, Axel; Cai, Wenju; Gupta, Alex Sen; McPhaden, Michael J.; Purich, Ariaan (1 March 2014). «Recent intensification of wind-driven circulation in the Pacific and the ongoing warming hiatus». Nature Climate Change. 4 (3): 222–27. Bibcode:2014NatCC…4..222E. doi:10.1038/nclimate2106. ISSN 1758-678X.
- ^ Brown, Patrick T.; Li, Wenhong; Li, Laifang; Ming, Yi (28 July 2014). «Top-of-atmosphere radiative contribution to unforced decadal global temperature variability in climate models». Geophysical Research Letters. 41 (14): 2014GL060625. Bibcode:2014GeoRL..41.5175B. doi:10.1002/2014GL060625. hdl:10161/9167. ISSN 1944-8007. S2CID 16933795.
- ^ Palmer, M. D.; McNeall, D. J. (1 January 2014). «Internal variability of Earth’s energy budget simulated by CMIP5 climate models». Environmental Research Letters. 9 (3): 034016. Bibcode:2014ERL…..9c4016P. doi:10.1088/1748-9326/9/3/034016. ISSN 1748-9326.
- ^ «El Niño & Other Oscillations». Woods Hole Oceanographic Institution. Retrieved 6 April 2019.
- ^ Wang, Chunzai (2018). «A review of ENSO theories». National Science Review. 5 (6): 813–825. doi:10.1093/nsr/nwy104. ISSN 2095-5138.
- ^ Climate Prediction Center (19 December 2005). «ENSO FAQ: How often do El Niño and La Niña typically occur?». National Centers for Environmental Prediction. Archived from the original on 27 August 2009. Retrieved 26 July 2009.
- ^ Kevin Krajick. «Part of the Pacific Ocean Is Not Warming as Expected. Why». Columbia University Lamont-Doherty Earth Observatory. Retrieved 2 November 2022.
- ^ Aristos Georgiou. «Mystery Stretch of the Pacific Ocean Is Not Warming Like the Rest of the World’s Waters». Newsweek. Retrieved 2 November 2022.
- ^ «What is the MJO, and why do we care?». NOAA Climate.gov. Retrieved 6 April 2019.
- ^ National Center for Atmospheric Research. Climate Analysis Section. Archived 22 June 2006 at the Wayback Machine Retrieved on 7 June 2007.
- ^ Baldwin, M. P.; Gray, L. J.; Dunkerton, T. J.; Hamilton, K.; Haynes, P. H.; Randel, W. J.; Holton, J. R.; Alexander, M. J.; Hirota, I. (2001). «The quasi-biennial oscillation». Reviews of Geophysics. 39 (2): 179–229. Bibcode:2001RvGeo..39..179B. doi:10.1029/1999RG000073. S2CID 16727059.
- ^ Newman, Matthew; Alexander, Michael A.; Ault, Toby R.; Cobb, Kim M.; Deser, Clara; Di Lorenzo, Emanuele; Mantua, Nathan J.; Miller, Arthur J.; Minobe, Shoshiro (2016). «The Pacific Decadal Oscillation, Revisited». Journal of Climate. 29 (12): 4399–4427. Bibcode:2016JCli…29.4399N. doi:10.1175/JCLI-D-15-0508.1. ISSN 0894-8755. S2CID 4824093.
- ^ «Interdecadal Pacific Oscillation». NIWA. 19 January 2016. Retrieved 6 April 2019.
- ^ Kuijpers, Antoon; Bo Holm Jacobsen; Seidenkrantz, Marit-Solveig; Knudsen, Mads Faurschou (2011). «Tracking the Atlantic Multidecadal Oscillation through the last 8,000 years». Nature Communications. 2: 178–. Bibcode:2011NatCo…2..178K. doi:10.1038/ncomms1186. ISSN 2041-1723. PMC 3105344. PMID 21285956.
- ^ Skonieczny, C. (2 January 2019). «Monsoon-driven Saharan dust variability over the past 240,000 years». Science Advances. 5 (1): eaav1887. Bibcode:2019SciA….5.1887S. doi:10.1126/sciadv.aav1887. PMC 6314818. PMID 30613782.
- ^ Thompson, David. «Annular Modes — Introduction». Retrieved 11 February 2020.
- ^ Burroughs 2001, pp. 207–08.
- ^ Spracklen, D. V.; Bonn, B.; Carslaw, K. S. (2008). «Boreal forests, aerosols and the impacts on clouds and climate». Philosophical Transactions of the Royal Society A: Mathematical, Physical and Engineering Sciences. 366 (1885): 4613–26. Bibcode:2008RSPTA.366.4613S. doi:10.1098/rsta.2008.0201. PMID 18826917. S2CID 206156442.
- ^ Christner, B. C.; Morris, C. E.; Foreman, C. M.; Cai, R.; Sands, D. C. (2008). «Ubiquity of Biological Ice Nucleators in Snowfall» (PDF). Science. 319 (5867): 1214. Bibcode:2008Sci…319.1214C. doi:10.1126/science.1149757. PMID 18309078. S2CID 39398426. Archived (PDF) from the original on 5 March 2020.
- ^ Schwartzman, David W.; Volk, Tyler (1989). «Biotic enhancement of weathering and the habitability of Earth». Nature. 340 (6233): 457–60. Bibcode:1989Natur.340..457S. doi:10.1038/340457a0. S2CID 4314648.
- ^ Kopp, R.E.; Kirschvink, J.L.; Hilburn, I.A.; Nash, C.Z. (2005). «The Paleoproterozoic snowball Earth: A climate disaster triggered by the evolution of oxygenic photosynthesis». Proceedings of the National Academy of Sciences. 102 (32): 11131–36. Bibcode:2005PNAS..10211131K. doi:10.1073/pnas.0504878102. PMC 1183582. PMID 16061801.
- ^ Kasting, J.F.; Siefert, JL (2002). «Life and the Evolution of Earth’s Atmosphere». Science. 296 (5570): 1066–68. Bibcode:2002Sci…296.1066K. doi:10.1126/science.1071184. PMID 12004117. S2CID 37190778.
- ^ Mora, C.I.; Driese, S.G.; Colarusso, L. A. (1996). «Middle to Late Paleozoic Atmospheric CO2 Levels from Soil Carbonate and Organic Matter». Science. 271 (5252): 1105–07. Bibcode:1996Sci…271.1105M. doi:10.1126/science.271.5252.1105. S2CID 128479221.
- ^ Berner, R.A. (1999). «Atmospheric oxygen over Phanerozoic time». Proceedings of the National Academy of Sciences. 96 (20): 10955–57. Bibcode:1999PNAS…9610955B. doi:10.1073/pnas.96.20.10955. PMC 34224. PMID 10500106.
- ^ Bains, Santo; Norris, Richard D.; Corfield, Richard M.; Faul, Kristina L. (2000). «Termination of global warmth at the Palaeocene/Eocene boundary through productivity feedback». Nature. 407 (6801): 171–74. Bibcode:2000Natur.407..171B. doi:10.1038/35025035. PMID 11001051. S2CID 4419536.
- ^ Zachos, J.C.; Dickens, G.R. (2000). «An assessment of the biogeochemical feedback response to the climatic and chemical perturbations of the LPTM». GFF. 122: 188–89. doi:10.1080/11035890001221188. S2CID 129797785.
- ^ Speelman, E.N.; Van Kempen, M.M.L.; Barke, J.; Brinkhuis, H.; Reichart, G.J.; Smolders, A.J.P.; Roelofs, J.G.M.; Sangiorgi, F.; De Leeuw, J.W.; Lotter, A.F.; Sinninghe Damsté, J.S. (2009). «The Eocene Arctic Azolla bloom: Environmental conditions, productivity and carbon drawdown». Geobiology. 7 (2): 155–70. doi:10.1111/j.1472-4669.2009.00195.x. PMID 19323694. S2CID 13206343.
- ^ Brinkhuis, Henk; Schouten, Stefan; Collinson, Margaret E.; Sluijs, Appy; Sinninghe Damsté, Jaap S. Sinninghe; Dickens, Gerald R.; Huber, Matthew; Cronin, Thomas M.; Onodera, Jonaotaro; Takahashi, Kozo; Bujak, Jonathan P.; Stein, Ruediger; Van Der Burgh, Johan; Eldrett, James S.; Harding, Ian C.; Lotter, André F.; Sangiorgi, Francesca; Van Konijnenburg-Van Cittert, Han van Konijnenburg-van; De Leeuw, Jan W.; Matthiessen, Jens; Backman, Jan; Moran, Kathryn; Expedition 302, Scientists (2006). «Episodic fresh surface waters in the Eocene Arctic Ocean». Nature. 441 (7093): 606–09. Bibcode:2006Natur.441..606B. doi:10.1038/nature04692. hdl:11250/174278. PMID 16752440. S2CID 4412107.
- ^ Retallack, Gregory J. (2001). «Cenozoic Expansion of Grasslands and Climatic Cooling». The Journal of Geology. 109 (4): 407–26. Bibcode:2001JG….109..407R. doi:10.1086/320791. S2CID 15560105.
- ^ Dutton, Jan F.; Barron, Eric J. (1997). «Miocene to present vegetation changes: A possible piece of the Cenozoic cooling puzzle». Geology. 25 (1): 39. Bibcode:1997Geo….25…39D. doi:10.1130/0091-7613(1997)025<0039:MTPVCA>2.3.CO;2.
- ^ Cronin 2010, p. 17
- ^ «3. Are human activities causing climate change?». science.org.au. Australian Academy of Science. Retrieved 12 August 2017.
- ^ Antoaneta Yotova, ed. (2009). «Anthropogenic Climate Influences». Climate Change, Human Systems and Policy Volume I. Eolss Publishers. ISBN 978-1-905839-02-5.
- ^ Steinfeld, H.; P. Gerber; T. Wassenaar; V. Castel; M. Rosales; C. de Haan (2006). Livestock’s long shadow.
- ^ The Editorial Board (28 November 2015). «What the Paris Climate Meeting Must Do». The New York Times. Retrieved 28 November 2015.
- ^ «Volcanic Gases and Their Effects». U.S. Department of the Interior. 10 January 2006. Retrieved 21 January 2008.
- ^ «Human Activities Emit Way More Carbon Dioxide Than Do Volcanoes». American Geophysical Union. 14 June 2011. Retrieved 20 June 2011.
- ^ a b «Milankovitch Cycles and Glaciation». University of Montana. Archived from the original on 16 July 2011. Retrieved 2 April 2009.
- ^ Gale, Andrew S. (1989). «A Milankovitch scale for Cenomanian time». Terra Nova. 1 (5): 420–25. Bibcode:1989TeNov…1..420G. doi:10.1111/j.1365-3121.1989.tb00403.x.
- ^ «Same forces as today caused climate changes 1.4 billion years ago». sdu.dk. University of Denmark. Archived from the original on 12 March 2015.
- ^ a b van Nes, Egbert H.; Scheffer, Marten; Brovkin, Victor; Lenton, Timothy M.; Ye, Hao; Deyle, Ethan; Sugihara, George (2015). «Causal feedbacks in climate change». Nature Climate Change. 5 (5): 445–48. Bibcode:2015NatCC…5..445V. doi:10.1038/nclimate2568. ISSN 1758-6798.
- ^ Box 6.2: What Caused the Low Atmospheric Carbon Dioxide Concentrations During Glacial Times? Archived 8 January 2023 at the Wayback Machine in IPCC AR4 WG1 2007 .
- ^ a b Rohli & Vega 2018, p. 296.
- ^ Willson, Richard C.; Hudson, Hugh S. (1991). «The Sun’s luminosity over a complete solar cycle». Nature. 351 (6321): 42–44. Bibcode:1991Natur.351…42W. doi:10.1038/351042a0. S2CID 4273483.
- ^ Turner, T. Edward; Swindles, Graeme T.; Charman, Dan J.; Langdon, Peter G.; Morris, Paul J.; Booth, Robert K.; Parry, Lauren E.; Nichols, Jonathan E. (5 April 2016). «Solar cycles or random processes? Evaluating solar variability in Holocene climate records». Scientific Reports. 6 (1): 23961. doi:10.1038/srep23961. ISSN 2045-2322. PMC 4820721. PMID 27045989.
- ^ Ribas, Ignasi (February 2010). The Sun and stars as the primary energy input in planetary atmospheres. IAU Symposium 264 ‘Solar and Stellar Variability – Impact on Earth and Planets’. Proceedings of the International Astronomical Union. Vol. 264. pp. 3–18. arXiv:0911.4872. Bibcode:2010IAUS..264….3R. doi:10.1017/S1743921309992298.
- ^ a b Marty, B. (2006). «Water in the Early Earth». Reviews in Mineralogy and Geochemistry. 62 (1): 421–450. Bibcode:2006RvMG…62..421M. doi:10.2138/rmg.2006.62.18.
- ^ Watson, E.B.; Harrison, TM (2005). «Zircon Thermometer Reveals Minimum Melting Conditions on Earliest Earth». Science. 308 (5723): 841–44. Bibcode:2005Sci…308..841W. doi:10.1126/science.1110873. PMID 15879213. S2CID 11114317.
- ^ Hagemann, Steffen G.; Gebre-Mariam, Musie; Groves, David I. (1994). «Surface-water influx in shallow-level Archean lode-gold deposits in Western, Australia». Geology. 22 (12): 1067. Bibcode:1994Geo….22.1067H. doi:10.1130/0091-7613(1994)022<1067:SWIISL>2.3.CO;2.
- ^ Sagan, C.; G. Mullen (1972). «Earth and Mars: Evolution of Atmospheres and Surface Temperatures». Science. 177 (4043): 52–6. Bibcode:1972Sci…177…52S. doi:10.1126/science.177.4043.52. PMID 17756316. S2CID 12566286.
- ^ Sagan, C.; Chyba, C (1997). «The Early Faint Sun Paradox: Organic Shielding of Ultraviolet-Labile Greenhouse Gases». Science. 276 (5316): 1217–21. Bibcode:1997Sci…276.1217S. doi:10.1126/science.276.5316.1217. PMID 11536805.
- ^ Schröder, K.-P.; Connon Smith, Robert (2008), «Distant future of the Sun and Earth revisited», Monthly Notices of the Royal Astronomical Society, 386 (1): 155–63, arXiv:0801.4031, Bibcode:2008MNRAS.386..155S, doi:10.1111/j.1365-2966.2008.13022.x, S2CID 10073988
- ^ a b Miles, M.G.; Grainger, R.G.; Highwood, E.J. (2004). «The significance of volcanic eruption strength and frequency for climate». Quarterly Journal of the Royal Meteorological Society. 130 (602): 2361–76. Bibcode:2004QJRMS.130.2361M. doi:10.1256/qj.03.60. S2CID 53005926.
- ^ «Volcanic Gases and Climate Change Overview». usgs.gov. USGS. Retrieved 31 July 2014.
- ^ Annexes Archived 6 July 2019 at the Wayback Machine, in IPCC AR4 SYR 2008, p. 58.
- ^ Diggles, Michael (28 February 2005). «The Cataclysmic 1991 Eruption of Mount Pinatubo, Philippines». U.S. Geological Survey Fact Sheet 113-97. United States Geological Survey. Retrieved 8 October 2009.
- ^ Diggles, Michael. «The Cataclysmic 1991 Eruption of Mount Pinatubo, Philippines». usgs.gov. Retrieved 31 July 2014.
- ^ Oppenheimer, Clive (2003). «Climatic, environmental and human consequences of the largest known historic eruption: Tambora volcano (Indonesia) 1815». Progress in Physical Geography. 27 (2): 230–59. doi:10.1191/0309133303pp379ra. S2CID 131663534.
- ^ Black, Benjamin A.; Gibson, Sally A. (2019). «Deep Carbon and the Life Cycle of Large Igneous Provinces». Elements. 15 (5): 319–324. doi:10.2138/gselements.15.5.319.
- ^ Wignall, P (2001). «Large igneous provinces and mass extinctions». Earth-Science Reviews. 53 (1): 1–33. Bibcode:2001ESRv…53….1W. doi:10.1016/S0012-8252(00)00037-4.
- ^ Graf, H.-F.; Feichter, J.; Langmann, B. (1997). «Volcanic sulphur emissions: Estimates of source strength and its contribution to the global sulphate distribution». Journal of Geophysical Research: Atmospheres. 102 (D9): 10727–38. Bibcode:1997JGR…10210727G. doi:10.1029/96JD03265. hdl:21.11116/0000-0003-2CBB-A.
- ^ Forest, C.E.; Wolfe, J.A.; Molnar, P.; Emanuel, K.A. (1999). «Paleoaltimetry incorporating atmospheric physics and botanical estimates of paleoclimate». Geological Society of America Bulletin. 111 (4): 497–511. Bibcode:1999GSAB..111..497F. doi:10.1130/0016-7606(1999)111<0497:PIAPAB>2.3.CO;2. hdl:1721.1/10809.
- ^ «Panama: Isthmus that Changed the World». NASA Earth Observatory. Archived from the original on 2 August 2007. Retrieved 1 July 2008.
- ^ Haug, Gerald H.; Keigwin, Lloyd D. (22 March 2004). «How the Isthmus of Panama Put Ice in the Arctic». Oceanus. Woods Hole Oceanographic Institution. 42 (2). Retrieved 1 October 2013.
- ^ Bruckschen, Peter; Oesmanna, Susanne; Veizer, Ján (30 September 1999). «Isotope stratigraphy of the European Carboniferous: proxy signals for ocean chemistry, climate and tectonics». Chemical Geology. 161 (1–3): 127–63. Bibcode:1999ChGeo.161..127B. doi:10.1016/S0009-2541(99)00084-4.
- ^ Parrish, Judith T. (1993). «Climate of the Supercontinent Pangea». The Journal of Geology. The University of Chicago Press. 101 (2): 215–33. Bibcode:1993JG….101..215P. doi:10.1086/648217. JSTOR 30081148. S2CID 128757269.
- ^ Hausfather, Zeke (18 August 2017). «Explainer: Why the sun is not responsible for recent climate change». Carbon Brief. Retrieved 5 September 2019.
- ^ Pierce, J. R. (2017). «Cosmic rays, aerosols, clouds, and climate: Recent findings from the CLOUD experiment». Journal of Geophysical Research: Atmospheres. 122 (15): 8051–55. Bibcode:2017JGRD..122.8051P. doi:10.1002/2017JD027475. ISSN 2169-8996. S2CID 125580175.
- ^ Brugger, Julia; Feulner, Georg; Petri, Stefan (April 2017), «Severe environmental effects of Chicxulub impact imply key role in end-Cretaceous mass extinction», 19th EGU General Assembly, EGU2017, proceedings from the conference, 23–28 April 2017, vol. 19, Vienna, Austria, p. 17167, Bibcode:2017EGUGA..1917167B.
- ^ Burroughs 2001, p. 232.
- ^ Hadlington, Simon 9 (May 2013). «Mineral dust plays key role in cloud formation and chemistry». Chemistry World. Retrieved 5 September 2019.
- ^ Mahowald, Natalie; Albani, Samuel; Kok, Jasper F.; Engelstaeder, Sebastian; Scanza, Rachel; Ward, Daniel S.; Flanner, Mark G. (1 December 2014). «The size distribution of desert dust aerosols and its impact on the Earth system». Aeolian Research. 15: 53–71. Bibcode:2014AeoRe..15…53M. doi:10.1016/j.aeolia.2013.09.002. ISSN 1875-9637.
- ^ New, M.; Todd, M.; Hulme, M; Jones, P. (December 2001). «Review: Precipitation measurements and trends in the twentieth century». International Journal of Climatology. 21 (15): 1889–922. Bibcode:2001IJCli..21.1889N. doi:10.1002/joc.680. S2CID 56212756.
- ^ a b Demenocal, P.B. (2001). «Cultural Responses to Climate Change During the Late Holocene» (PDF). Science. 292 (5517): 667–73. Bibcode:2001Sci…292..667D. doi:10.1126/science.1059827. PMID 11303088. S2CID 18642937. Archived from the original (PDF) on 17 December 2008. Retrieved 28 August 2015.
- ^ Sindbaek, S.M. (2007). «Networks and nodal points: the emergence of towns in early Viking Age Scandinavia». Antiquity. 81 (311): 119–32. doi:10.1017/s0003598x00094886.
- ^ Dominic, F.; Burns, S.J.; Neff, U.; Mudulsee, M.; Mangina, A; Matter, A. (April 2004). «Palaeoclimatic interpretation of high-resolution oxygen isotope profiles derived from annually laminated speleothems from Southern Oman». Quaternary Science Reviews. 23 (7–8): 935–45. Bibcode:2004QSRv…23..935F. doi:10.1016/j.quascirev.2003.06.019.
- ^ Hughes, Malcolm K.; Swetnam, Thomas W.; Diaz, Henry F., eds. (2010). Dendroclimatology: progress and prospect. Developments in Paleoenvironmental Research. Vol. 11. New York: Springer Science & Business Media. ISBN 978-1-4020-4010-8.
- ^ Langdon, P.G.; Barber, K.E.; Lomas-Clarke, S.H.; Lomas-Clarke, S.H. (August 2004). «Reconstructing climate and environmental change in northern England through chironomid and pollen analyses: evidence from Talkin Tarn, Cumbria». Journal of Paleolimnology. 32 (2): 197–213. Bibcode:2004JPall..32..197L. doi:10.1023/B:JOPL.0000029433.85764.a5. S2CID 128561705.
- ^ Birks, H.H. (March 2003). «The importance of plant macrofossils in the reconstruction of Lateglacial vegetation and climate: examples from Scotland, western Norway, and Minnesota, US» (PDF). Quaternary Science Reviews. 22 (5–7): 453–73. Bibcode:2003QSRv…22..453B. doi:10.1016/S0277-3791(02)00248-2. hdl:1956/387. Archived from the original (PDF) on 11 June 2007. Retrieved 20 April 2018.
- ^ Miyoshi, N; Fujiki, Toshiyuki; Morita, Yoshimune (1999). «Palynology of a 250-m core from Lake Biwa: a 430,000-year record of glacial–interglacial vegetation change in Japan». Review of Palaeobotany and Palynology. 104 (3–4): 267–83. doi:10.1016/S0034-6667(98)00058-X.
- ^ Prentice, I. Colin; Bartlein, Patrick J; Webb, Thompson (1991). «Vegetation and Climate Change in Eastern North America Since the Last Glacial Maximum». Ecology. 72 (6): 2038–56. doi:10.2307/1941558. JSTOR 1941558.
- ^ Coope, G.R.; Lemdahl, G.; Lowe, J.J.; Walkling, A. (4 May 1999). «Temperature gradients in northern Europe during the last glacial – Holocene transition (14–9 14 C kyr BP) interpreted from coleopteran assemblages». Journal of Quaternary Science. 13 (5): 419–33. Bibcode:1998JQS….13..419C. doi:10.1002/(SICI)1099-1417(1998090)13:5<419::AID-JQS410>3.0.CO;2-D.
- ^ a b c Adams, J.M.; Faure, H., eds. (1997). «Global land environments since the last interglacial». Tennessee: Oak Ridge National Laboratory. Archived from the original on 16 January 2008. QEN members.
- ^ Ochoa-Hueso, R; Delgado-Baquerizo, N; King, PTA; Benham, M; Arca, V; Power, SA (2019). «Ecosystem type and resource quality are more important than global change drivers in regulating early stages of litter decomposition». Soil Biology and Biochemistry. 129: 144–52. doi:10.1016/j.soilbio.2018.11.009. S2CID 92606851.
- ^ Kinver, Mark (15 November 2011). «UK trees’ fruit ripening ’18 days earlier’«. Bbc.co.uk. Retrieved 1 November 2012.
- ^ a b Sahney, S.; Benton, M.J.; Falcon-Lang, H.J. (2010). «Rainforest collapse triggered Pennsylvanian tetrapod diversification in Euramerica» (PDF). Geology. 38 (12): 1079–82. Bibcode:2010Geo….38.1079S. doi:10.1130/G31182.1. Retrieved 27 November 2013.
- ^ Bachelet, D.; Neilson, R.; Lenihan, J. M.; Drapek, R.J. (2001). «Climate Change Effects on Vegetation Distribution and Carbon Budget in the United States». Ecosystems. 4 (3): 164–85. doi:10.1007/s10021-001-0002-7. S2CID 15526358.
- ^ Burroughs 2007, p. 273.
- ^ Millington, Rebecca; Cox, Peter M.; Moore, Jonathan R.; Yvon-Durocher, Gabriel (10 May 2019). «Modelling ecosystem adaptation and dangerous rates of global warming». Emerging Topics in Life Sciences. 3 (2): 221–31. doi:10.1042/ETLS20180113. hdl:10871/36988. ISSN 2397-8554. PMID 33523155. S2CID 150221323.
- ^ Burroughs 2007, p. 267.
- ^ Seiz, G.; N. Foppa (2007). The activities of the World Glacier Monitoring Service (WGMS) (PDF) (Report). Archived from the original (PDF) on 25 March 2009. Retrieved 21 June 2009.
- ^ «International Stratigraphic Chart». International Commission on Stratigraphy. 2008. Archived from the original on 15 October 2011. Retrieved 3 October 2011.
- ^ Burroughs 2007, p. 279.
- ^ Hansen, James. «Science Briefs: Earth’s Climate History». NASA GISS. Archived from the original on 24 July 2011. Retrieved 25 April 2013.
- ^ Belt, Simon T.; Cabedo-Sanz, Patricia; Smik, Lukas; et al. (2015). «Identification of paleo Arctic winter sea ice limits and the marginal ice zone: Optimised biomarker-based reconstructions of late Quaternary Arctic sea ice». Earth and Planetary Science Letters. 431: 127–39. Bibcode:2015E&PSL.431..127B. doi:10.1016/j.epsl.2015.09.020. hdl:10026.1/4335. ISSN 0012-821X.
- ^ Warren, Stephen G.; Voigt, Aiko; Tziperman, Eli; et al. (1 November 2017). «Snowball Earth climate dynamics and Cryogenian geology-geobiology». Science Advances. 3 (11): e1600983. Bibcode:2017SciA….3E0983H. doi:10.1126/sciadv.1600983. ISSN 2375-2548. PMC 5677351. PMID 29134193.
- ^ Caballero, R.; Huber, M. (2013). «State-dependent climate sensitivity in past warm climates and its implications for future climate projections». Proceedings of the National Academy of Sciences. 110 (35): 14162–67. Bibcode:2013PNAS..11014162C. doi:10.1073/pnas.1303365110. ISSN 0027-8424. PMC 3761583. PMID 23918397.
- ^ Hansen James; Sato Makiko; Russell Gary; Kharecha Pushker (2013). «Climate sensitivity, sea level and atmospheric carbon dioxide». Philosophical Transactions of the Royal Society A: Mathematical, Physical and Engineering Sciences. 371 (2001): 20120294. arXiv:1211.4846. Bibcode:2013RSPTA.37120294H. doi:10.1098/rsta.2012.0294. PMC 3785813. PMID 24043864.
- ^ a b McInherney, F.A..; Wing, S. (2011). «A perturbation of carbon cycle, climate, and biosphere with implications for the future». Annual Review of Earth and Planetary Sciences. 39: 489–516. Bibcode:2011AREPS..39..489M. doi:10.1146/annurev-earth-040610-133431.
- ^ Westerhold, T..; Röhl, U.; Raffi, I.; Fornaciari, E.; Monechi, S.; Reale, V.; Bowles, J.; Evans, H. F. (2008). «Astronomical calibration of the Paleocene time» (PDF). Palaeogeography, Palaeoclimatology, Palaeoecology. 257 (4): 377–403. Bibcode:2008PPP…257..377W. doi:10.1016/j.palaeo.2007.09.016. Archived (PDF) from the original on 9 August 2017.
- ^ Burroughs 2007, pp. 190–91.
- ^ Ivany, Linda C.; Pietsch, Carlie; Handley, John C.; Lockwood, Rowan; Allmon, Warren D.; Sessa, Jocelyn A. (1 September 2018). «Little lasting impact of the Paleocene-Eocene Thermal Maximum on shallow marine molluscan faunas». Science Advances. 4 (9): eaat5528. Bibcode:2018SciA….4.5528I. doi:10.1126/sciadv.aat5528. ISSN 2375-2548. PMC 6124918. PMID 30191179.
- ^ Haerter, Jan O.; Moseley, Christopher; Berg, Peter (2013). «Strong increase in convective precipitation in response to higher temperatures». Nature Geoscience. 6 (3): 181–85. Bibcode:2013NatGe…6..181B. doi:10.1038/ngeo1731. ISSN 1752-0908.
- ^ Kaufman, Darrell; McKay, Nicholas; Routson, Cody; Erb, Michael; Dätwyler, Christoph; Sommer, Philipp S.; Heiri, Oliver; Davis, Basil (30 June 2020). «Holocene global mean surface temperature, a multi-method reconstruction approach». Scientific Data. 7 (1): 201. Bibcode:2020NatSD…7..201K. doi:10.1038/s41597-020-0530-7. ISSN 2052-4463. PMC 7327079. PMID 32606396.
- ^ Zemp, M.; I.Roer; A.Kääb; M.Hoelzle; F.Paul; W. Haeberli (2008). United Nations Environment Programme – Global Glacier Changes: facts and figures (PDF) (Report). Archived from the original (PDF) on 25 March 2009. Retrieved 21 June 2009.
- ^ EPA, OA, US (July 2016). «Climate Change Indicators: Glaciers». US EPA.
- ^ «Land ice – NASA Global Climate Change».
- ^ Shaftel, Holly (ed.). «Climate Change: How do we know?». NASA Global Climate Change. Earth Science Communications Team at NASA’s Jet Propulsion Laboratory. Retrieved 16 December 2017.
- ^ «GISS Surface Temperature Analysis (v4) / Annual Mean Temperature Change over Land and over Ocean». NASA GISS. Archived from the original on 16 April 2020.
- ^ a b Harvey, Chelsea (1 November 2018). «The Oceans Are Heating Up Faster Than Expected». Scientific American. Archived from the original on 3 March 2020. Data from NASA GISS.
- ^ «GISS Surface Temperature Analysis (v4) / Annual Mean Temperature Change for Hemispheres». NASA GISS. Archived from the original on 16 April 2020.
- ^ a b Freedman, Andrew (9 April 2013). «In Warming, Northern Hemisphere is Outpacing the South». Climate Central. Archived from the original on 31 October 2019.
- ^ a b «GISS Surface Temperature Analysis (v4) / Temperature Change for Three Latitude Bands». NASA GISS. Archived from the original on 16 April 2020.
- ^ a b Hawkins, Ed (12 September 2019). «Atmospheric temperature trends». Climate Lab Book. Archived from the original on 12 September 2019. (Higher-altitude cooling differences attributed to ozone depletion and greenhouse gas increases; spikes occurred with volcanic eruptions of 1982-83 (El Chichón) and 1991-92 (Pinatubo).)
- ^ a b Meduna, Veronika (17 September 2018). «The climate visualisations that leave no room for doubt or denial». The Spinoff. New Zealand. Archived from the original on 17 May 2019.
- ^ «Climate at a Glance / Global Time Series». NCDC / NOAA. Archived from the original on 23 February 2020.
- ^ a b Hawkins, Ed (10 March 2020). «From the familiar to the unknown». Climate Lab Book (professional blog). Archived from the original on 23 April 2020. (Direct link to image; Hawkins credits Berkeley Earth for data.) «The emergence of observed temperature changes over both land and ocean is clearest in tropical regions, in contrast to the regions of largest change which are in the northern extra-tropics. As an illustration, northern America has warmed more than tropical America, but the changes in the tropics are more apparent and have more clearly emerged from the range of historical variability. The year-to-year variations in the higher latitudes have made it harder to distinguish the long-term changes.»
- ^ a b Lenton, Timothy M.; Rockström, Johan; Gaffney, Owen; Rahmstorf, Stefan; Richardson, Katherine; Steffen, Will; Schellnhuber, Hans Joachim (27 November 2019). «Climate tipping points — too risky to bet against». Nature. 575 (7784): 592–595. Bibcode:2019Natur.575..592L. doi:10.1038/d41586-019-03595-0. PMID 31776487. Correction dated 9 April 2020
References
- Cronin, Thomas N. (2010). Paleoclimates: understanding climate change past and present. New York: Columbia University Press. ISBN 978-0-231-14494-0.
- IPCC (2007). Solomon, S.; Qin, D.; Manning, M.; Chen, Z.; et al. (eds.). Climate Change 2007: The Physical Science Basis (PDF). Contribution of Working Group I to the Fourth Assessment Report of the Intergovernmental Panel on Climate Change. Cambridge University Press. ISBN 978-0-521-88009-1. (pb: 978-0-521-70596-7).
- IPCC (2008). The Core Writing Team; Pachauri, R.K.; Reisinger, A.R. (eds.). Climate Change 2008: Synthesis Report. Contribution of Working Groups I, II and III to the Fourth Assessment Report of the Intergovernmental Panel on Climate Change. Geneva, Switzerland: IPCC. ISBN 978-92-9169-122-7.[permanent dead link].
- Burroughs, William James (2001). Climate Change : A multidisciplinary approach. Cambridge: Cambridge university press. ISBN 0521567718.
- Burroughs, William James (2007). Climate Change : A multidisciplinary approach. Cambridge: Cambridge university press. ISBN 978-0-511-37027-4.
- Ruddiman, William F. (2008). Earth’s climate : Past and Future. New York: W. H. Freeman and Company. ISBN 9780716784906.
- Rohli, Robert. V.; Vega, Anthony J. (2018). Climatology (fourth ed.). Jones & Bartlett Learning. ISBN 9781284126563.
External links
- Global Climate Change from NASA (US)
- Intergovernmental Panel on Climate Change (IPCC)
- Climate Variability – NASA Science
- Climate Change and Variability, National Centers for Environmental Information Archived 21 September 2021 at the Wayback Machine
Они хотели решить проблемы безработицы и перенаселения, помочь сельскому хозяйству. Но их идеи оказались опасны для планеты, а некоторые разработки признали климатическим оружием.
Осушить Средиземное море
Цель: создать новый сверхконтинент, обеспечить Европу электроэнергией, улучшить климат Африки, решить проблему с безработицей и перенаселением, обводнить Сахару.
Проект немецкого архитектора Германа Зёргеля «Атлантропа» впервые опубликовали в 1920 году. Для его реализации Зёргель предлагал перекрыть проливы Гибралтарский и Дарданеллы гидроэлектрическими дамбами, а ещё одной дамбой соединить итальянский остров Сицилия с территорией Туниса.
В результате Средиземное море разбилось бы на два бассейна, а за счёт отделения от Атлантического океана уровень воды в западной части должен был снизится на 100 метров, в восточной — на 200. Площадь моря сократилась бы на 20%, обнажив около 600 тысяч км² новой земли.
Архитектор учёл реки, впадающие в Средиземное море, и предложил тоже перекрыть их дамбами. По его расчётам, вода в дамбах генерировала бы 110 тысяч МВт чистой электроэнергии.
На территории самой Африки предполагалось затопить бассейн реки Конго и создать Конголезское море, чтобы улучшить местный климат и сделать его более комфортным для европейских переселенцев. Для нового евроафриканского континента было готово название — Атлантропа.
Климатические, территориальные и иные непредсказуемые изменения коснулись бы 21 страны средиземноморского побережья. Причем Зёргель не принимал во внимание интересы большинства вовлечённых в проект стран. На реализацию проекта Зёргель отвёл 100 лет.
Зёргелю удалось создать институт Атлантропы и получить поддержку в правительственных кругах уже после окончания Второй мировой войны. Во время правления нацистов в Германии проект не получил одобрения Адольфа Гитлера, у которого был свой план по объединению Европы.
После свержения нацистского режима Зёргель вновь начал пропагандировать свою идею среди европейского сообщества, но отношения между государствами были слишком напряжены, чтобы рассматривать возможность объединения ради реализации утопического проекта.
Особенно против были страны Южной Европы: в случае реализации проекта приморские города утратили бы свою функциональность в качестве морских портов.
Зёргель продвигал свою идею до самой смерти в 1952 году. Вскоре после этого институт прекратил своё существование.
Вызвать дождь в пустыне
Цель: предотвратить распространение засухи.
Следующими изменить Сахару вызвались два российских физика Евгений Дёмин и Виктор Кушин. Они разработали проект изменения климата в отдельно взятой местности, в частности в Сахаре. По мнению учёных, причина засухи кроется в устойчивых антициклонах, в условиях которых не происходит образование облаков.
Чтобы изменить ситуацию, Дёмин и Кушин предлагали использовать метеотроны, созданные в 1967 году в СССР со схожей целью — спровоцировать дожди для нужд сельского хозяйства. Метеотроны посылают на многокилометровую высоту струю подготовленного воздуха — увлажнённого и разогретого от 380 до 950°C (в зависимости от режима работы), создавая тем самым условия для формирования циклона.
Физики полагали, что с их помощью можно оживить пустыню в относительно сжатые сроки, не более двух лет. Стоимость проекта также составляла около $60 млн.
Предполагалось, что достигнутый за два года положительный эффект изменения климата будет долговременным и дальнейшая помощь изобретения советских учёных не потребуется.
Проект не был реализован. Сейчас метеотроны называют климатическим оружием, поскольку с их помощью можно не только создавать вероятность дождя, но и (в теории) управлять температурой воздуха, ветром, вызывать засуху, заморозки и ураганы, причём не только в рамках отдельного региона, но и целого континента.
Растопить арктические льды
Цель: смягчить климат Крайнего Севера, создать пригодные для проживания условия.
Советский учёный Пётр Борисов предлагал построить плотину поперёк Берингова пролива, чтобы улучшить климат северных территорий СССР. Он разработал масштабный проект, основные идеи которого изложил в книге «Может ли человек изменить климат».
Определяющим фактором аномально низких температур он считал океанские течения, а именно — тёплый Гольфстрим и холодное Анадырское течение.
Гольфстрим на своём пути к берегам Чукотки встречается с потоком холодных тихоокеанских вод, которые пресекают Берингов пролив. Из-за этого скорость и температура вод Гольфстрима снижается, и берегов Шпицбергена он достигает с опозданием и значительно охлаждённым.
План Борисова был в том, чтобы замедлить движение тихоокеанских вод, открыв тёплым атлантическим свободный ход в Северный Ледовитый океан. Для этого инженер предложил перегородить плотиной Берингов пролив, а внутри плотины установить мощные насосы, работающие на атомной энергии.
Для ускорения таяния ледников Борисов предусмотрел дополнительные меры. Например, колоть лёд взрывами и ледоколами и проводить предварительное чернение льда.
Для перекачки воды требовалось около 25 млн кВт мощности. Сам проект оценивался в 22 млрд рублей и требовал от восьми до десяти лет на реализацию. Для обеспечения выполнения проектных работ в установленные сроки необходимо было основать два новых города численностью населения минимум по 50 тысяч человек.
После таяния льдов расход электроэнергии мог бы сократиться вдвое. По расчётам автора, первые изменения климата в пользу потепления должны были наступить спустя несколько лет проекта, и климат северных территорий мог стать комфортным и пригодным для жизни.
Так как вслед за советским севером отогрелись бы Аляска и Канада, проект получался международным. Более того, после наступления вечного лета на севере Борисов предлагал частично демонтировать плотину, проложить железную дорогу и автостраду, соединяющую СССР с Аляской. Борисов метафорично сравнивал смягчение климата северных территорий со смягчением климата политического.
Мнения учёных о последствиях реализации проекта Борисова расходятся. Российские учёные из Института биофизики клетки РАН под руководством специалиста по глобальной экологии Валерия Карнаухова считают, что нарушение естественного течения Гольфстрима приведёт к полной остановке его циркуляции в Атлантике, что спровоцирует новый ледниковый период.
В то же время Дэвид Лoурeнс и Эндрю Слэйтер, американские климатологи из Колорадского университета, просчитали вариант изменения климата в случае таяния ледников. По их мнению, это спровоцирует образование огромных заболоченных территорий на севере России и Канады. Произойдёт выброс в атмосферу миллиардов тонн углекислого газа и метана, сдерживаемых ледниками. От парникового эффекта пострадает вся планета.
Повернуть течение рек
Цель: обеспечить водой засушливые регионы Средней Азии.
Проект «поворота сибирских рек» был самым масштабным (хотя и не реализованным) в СССР по искусственному изменению климата: для него создали несколько проектных институтов, а все этапы реализации проекта планировали очень тщательно.
В 1868 году выпускник Киевского университета Яков Демченко опубликовал научную работу «О наводнении Арало-Каспийской низменности для улучшения климата прилежащих стран». Тогда исследование не привлекло широкого внимания.
В 1948 году советский академик Владимир Обручев представил на рассмотрение генеральному секретарю ЦК ВКП(б) Иосифу Сталину проект переброски части стока рек Оби и Иртыша в Аральское море, опираясь на работу Демченко.
Но к проекту вернулись только в 1960-е годы, когда правительство взяло устойчивый курс на подъём сельского хозяйства и развернулось активное водохозяйственное строительство.
В 1968 году пленум ЦК КПСС поручил Академии наук СССР детально проработать план поворота сибирских рек для решения таких задач, как:
- Снабжение пресной водой для полива сельскохозяйственных угодий на территории Казахстана, Туркменистана и Узбекистана.
- Снабжение пресной водой для нужд жизнедеятельности нескольких областей России.
Работа над проектом длилась почти 20 лет, в разработках были задействованы более 170 организаций. Общая стоимость проекта оценивалась в 32 млрд рублей. Окончательный проект утвердили в 1975 году, первые подготовительные работы начались в 1976 году и продолжались десять лет.
В 1985 году стало ясно, что в условиях надвигающегося экономического кризиса финансировать масштабный проект невозможно. В 1986 году проект заморозили.
В 2000 году бывший мэр Москвы Юрий Лужков выступил с докладом к президенту Владимиру Путину о возобновлении работы над проектом, несмотря на резкую критику учёных.
Академик РАН, руководитель Центра экологической политики Алексей Яблоков заявил, что экологии это грозит катастрофой. По его мнению, реализация проекта не принесёт ощутимой пользы, но может обернуться масштабными затоплениями по всему бассейну канала.
Страшное невежество утверждать, будто вода бессмысленно попадает в Северный Ледовитый океан. В природе нет ничего бессмысленного, и разрушать равновесие экосистемы очень опасно.
Реки — это кровеносные сосуды страны. Вы когда-нибудь видели, чтобы кровь по сосудам обращали вспять?
Алексей Яблоков, в интервью для газеты «Новые Известия»
Данных о том, что предложение было взято в работу, не поступало.
Затопить Сибирь
Цель: смягчить климат Сибири.
В 1950-х годах советский инженер и гидролог Митрофан Михайлович Давыдов строил планы по укрощению природы Западно-Сибирского региона, предлагая подчинить природную энергию рек нуждам человека. Подробно своё видение он изложил в книге «Рассказ о великих реках». Одной из его идей было создание искусственного моря в Сибири и строительства крупнейшей в мире ГЭС.
Для этого Давыдов предлагал перекрыть течения Оби и Енисея гигантскими плотинами, что приведёт к затоплению Западно-Сибирской равнины. Пресноводное море площадью около 300 тысяч км², по мнению автора проекта, могло бы смягчить сибирский климат, а заодно и напоить пустынные земли Средней Азии.
Помимо этого, Давыдов заложил в проект строительство нескольких крупных гидроэлектрических станций общей мощностью около 10 млн кВт.
Давыдов ошибся в расчётах. Совет по изучению производительных сил СССР при рассмотрении проекта установил, что инженер значительно занизил площадь и объём предполагаемого моря. Реализация проекта заняла бы более 20 лет.